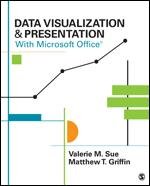
Data Visualization & Presentation With Microsoft Office: Read on SRM
This series of posts corresponds to the 2018 SAGE Research Methods Open House. If you would like to access the SAGE e-books, articles, case studies, videos, and datasets mentioned in these posts, explore SAGE Research Methods with a free trial.
 Visual communications are more important than ever. We need to draw readers into our articles, and keep attendees attention when presenting our work.You can download book chapters as PDFs, or save the book and other related resources as a Reading List. This is a great opportunity to look at some of SAGE's recent releases, including Data Visualization & Presentation With Microsoft Office.This is a practical book for anyone who needs to create presentations, or clear graphics for publications. That covers just about anyone, including your grad students! While the focus is on quantitative data visualization, it will be helpful to qualitative or mixed methods research with numerical foundations we need to present in an understandable way.Since the book uses Microsoft Office, most of us already have the software. In addition to looking at the book on SAGE Research Methods, you can visit the book's companion site for media and instructional resources.
