Open but not even: Database ethnography for exploring open data's inequalities
Ryan Burns and Grace Wark wrote an article for the Qualitative Research journal: “Where's the Database in Digital Ethnography? Exploring database ethnography for open data research" It demonstrates ways researchers rethink an existing method, in this case, ethnography. We invited him to contribute this explanatory post as a part of the Methodspace series on Emerging Methods. You can use the open-access link to the article for the month of June 2022.
Burns, R., & Wark, G. (2020). Where’s the database in digital ethnography? Exploring database ethnography for open data research. Qualitative Research, 20(5), 598–616. https://doi.org/10.1177/1468794119885040
Abstract: Contemporary cities are witnessing momentous shifts in how institutions and individuals produce and circulate data. Despite recent trends claiming that anyone can create and use data, cities remain marked by persistently uneven access and usage of digital technologies. This is the case as well within the emergent phenomenon of the ‘smart city,’ where open data are a key strategy for achieving ‘smartness,’ and increasingly constitute a fundamental dimension of urban life, governance, economic activity, and epistemology. The digital ethnography has extended traditional ethnographic research practices into such digital realms, yet its applicability within open data and smart cities is unclear. The method has tended to overlook the important roles of particular digital artifacts such as the database in structuring and producing knowledge. In this paper, we develop the database ethnography as a rich methodological resource for open data research. This approach centers the database as a key site for the production and materialization of social meaning. The database ethnography draws attention to the ways digital choices and practices—around database design, schema, data models, and so on—leave traces through time. From these traces, we may infer lessons about how phenomena come to be encoded as data and acted upon in urban contexts. Open databases are, in other words, key ways in which knowledges about the smart city are framed, delimited, and represented. More specifically, we argue that open databases limit data types, categorize and classify data to align with technical specifications, reflect the database designer’s episteme, and (re)produce conceptions of the world. We substantiate these claims through a database ethnography of the open data portal for the city of Calgary, in Western Canada.
You can also read a related open-access article by Burns and Welker from Big Data & Society:
Burns, R., & Welker, P. (2022). “Make our communities better through data”: The moral economy of smart city labor. Big Data & Society. https://doi.org/10.1177/20539517221106381
by Ryan Burns
Chances are high that if you’ve heard anything about open data, open government, or any of the other open+ concatenations, you encountered language like “transparency”, “accountability”, and “smart”. Openness has over the last few decades become a value pursued by sectors as diverse as international development, policing, and corporate finance. And who could dispute it, when the word holds such positive common-sense connotation? Who doesn’t want their institutions to be open? On first blush it seems to be beyond critique.
In our research, we step back from these taken-for-granted assumptions about the inherent desirability of openness, not to claim that institutions shouldn’t be “open”, but to show that the term actually has complex political and philosophical foundations and implications. The term can mean lots of different things for different people and groups, and doesn’t always have purely desirable outcomes. We want to show that openness is always enacted through policies that mobilize the term in particular ways. This means that it will always have uneven and unexpected impacts on communities. We’ve mostly focused on how open data are used within cities to help urban planners and administrators claim that their city is “smart”, “sustainable”, “transparent”, and “accountable”.
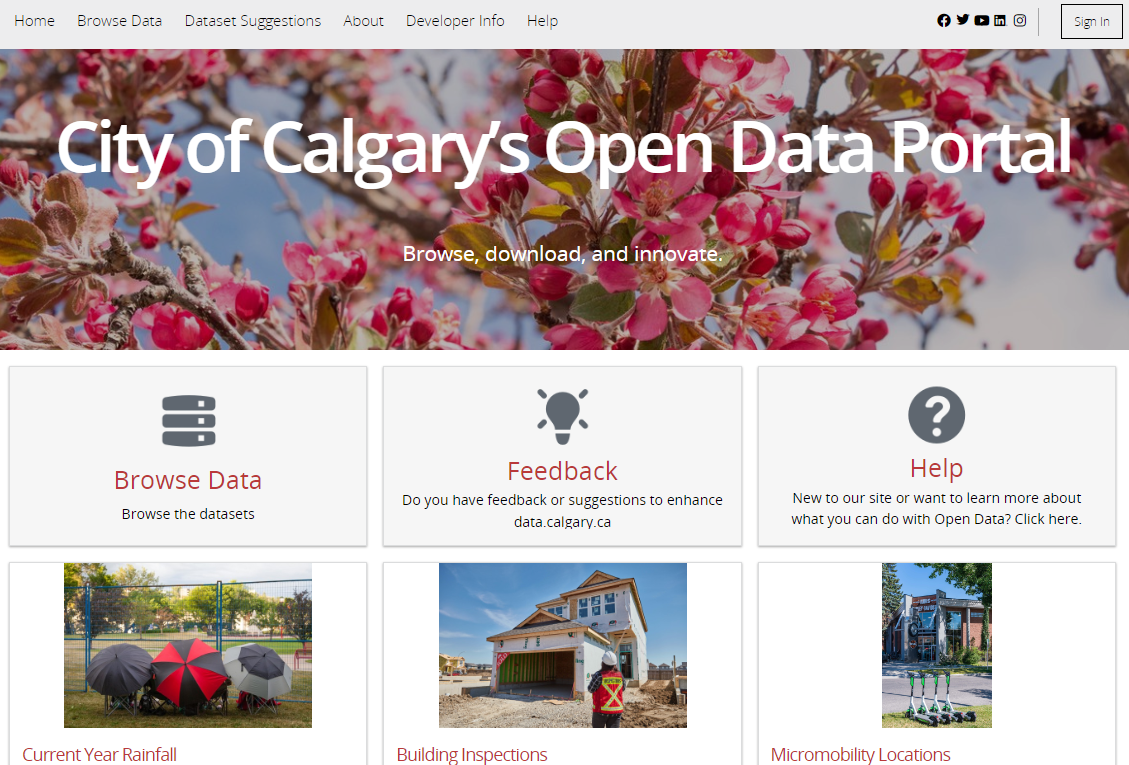
What’s really interesting about looking at open data is that, since those data are stored in databases, they both require someone to categorize the data, and they also record their own histories. Social scientists have long asked questions about how to study communities through digital technologies like chat rooms, social media platforms, and email listservs, but so far they have focused mostly on the communities rather than the ways the technologies mediate those communication channels. In our paper, we combine these insights to look at an open database as a mediator of politics around meaning and power. What we mean by this is that, whereas ethnographers used to drop into communities and observe their social interactions over a long period of time, we propose that social scientists can do the same thing for the open database. By observing how the database is organized and structured, as well as how it changes over time, we can glean some interesting insights into the unevenness and complexities of open data within cities. We sketch out the idea of a database ethnography as a way of systematically, rigorously, and scientifically examining the variety of political and social impacts open data have on a city. We tested this methodology in the city of Calgary, Alberta, a city that’s scrambling to expand its open data offerings to catch up with some nearby open data leaders like the city of Edmonton. Calgary’s open data platform is named Open Calgary.
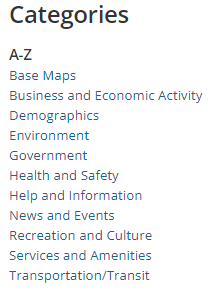
We’ve been able to generate many insights using the database ethnography, and in this paper we focused on four that we think productively illustrate the potential of this methodology. These four insights largely have to do with how the open database shapes the ways we think about our communities and environments within our cities. They let us see a bit about how inequalities emerge and are solidified in databases. First, we showed that city staff limit Open Calgary’s holdings to datasets that the City has generated. It’s a platform for government data release, not for circulating datasets by organizations, businesses, or individuals. This undermines open data’s claim to “accountability”: if the government gives you the datasets by which you’re supposed to hold them accountable, then they are setting the limits around the ways you can hold them accountable. Second, Open Calgary, like all databases, serves as a sort of contextualizing technology, fitting a phenomenon into the database’s established data models, categorization schema, and tagging structure. Phenomena that are captured as data must adhere to the rules and structures of the database, and if they do not, the database administrators are more likely to omit those data than they are to modify the database itself. Third, and related to this, Open Calgary informs its users how to think about the phenomena themselves. Data categories like “Environment” are populated with datasets that the database administrator thinks you will associate with this vague idea of an environment — but this, in turn, shapes how think of it. In other words, open databases are not mere representations of things, but actively construct what we think makes them what they are. Fourth, on some level Open Calgary reflects the database administrator’s views of the world. It reflects their technical knowledge of particular phenomena, such as in the case where Open Calgary’s administrator has earned a graduate degree in water resources and thus finely distinguishes between water and pollutant types. Open Calgary shows the administrator’s views of how things related to each other: for instance, does an airborne pollutants dataset belong under “Business and Economic Activity” since that’s how they’re generated? “Health and Safety” because of their health impacts? “Environment” because of how they circulate? Altogether, open data are not mere tools for keeping city governments transparent and holding them accountable, but are instead complex mediators of knowledge, power, and resource distribution.
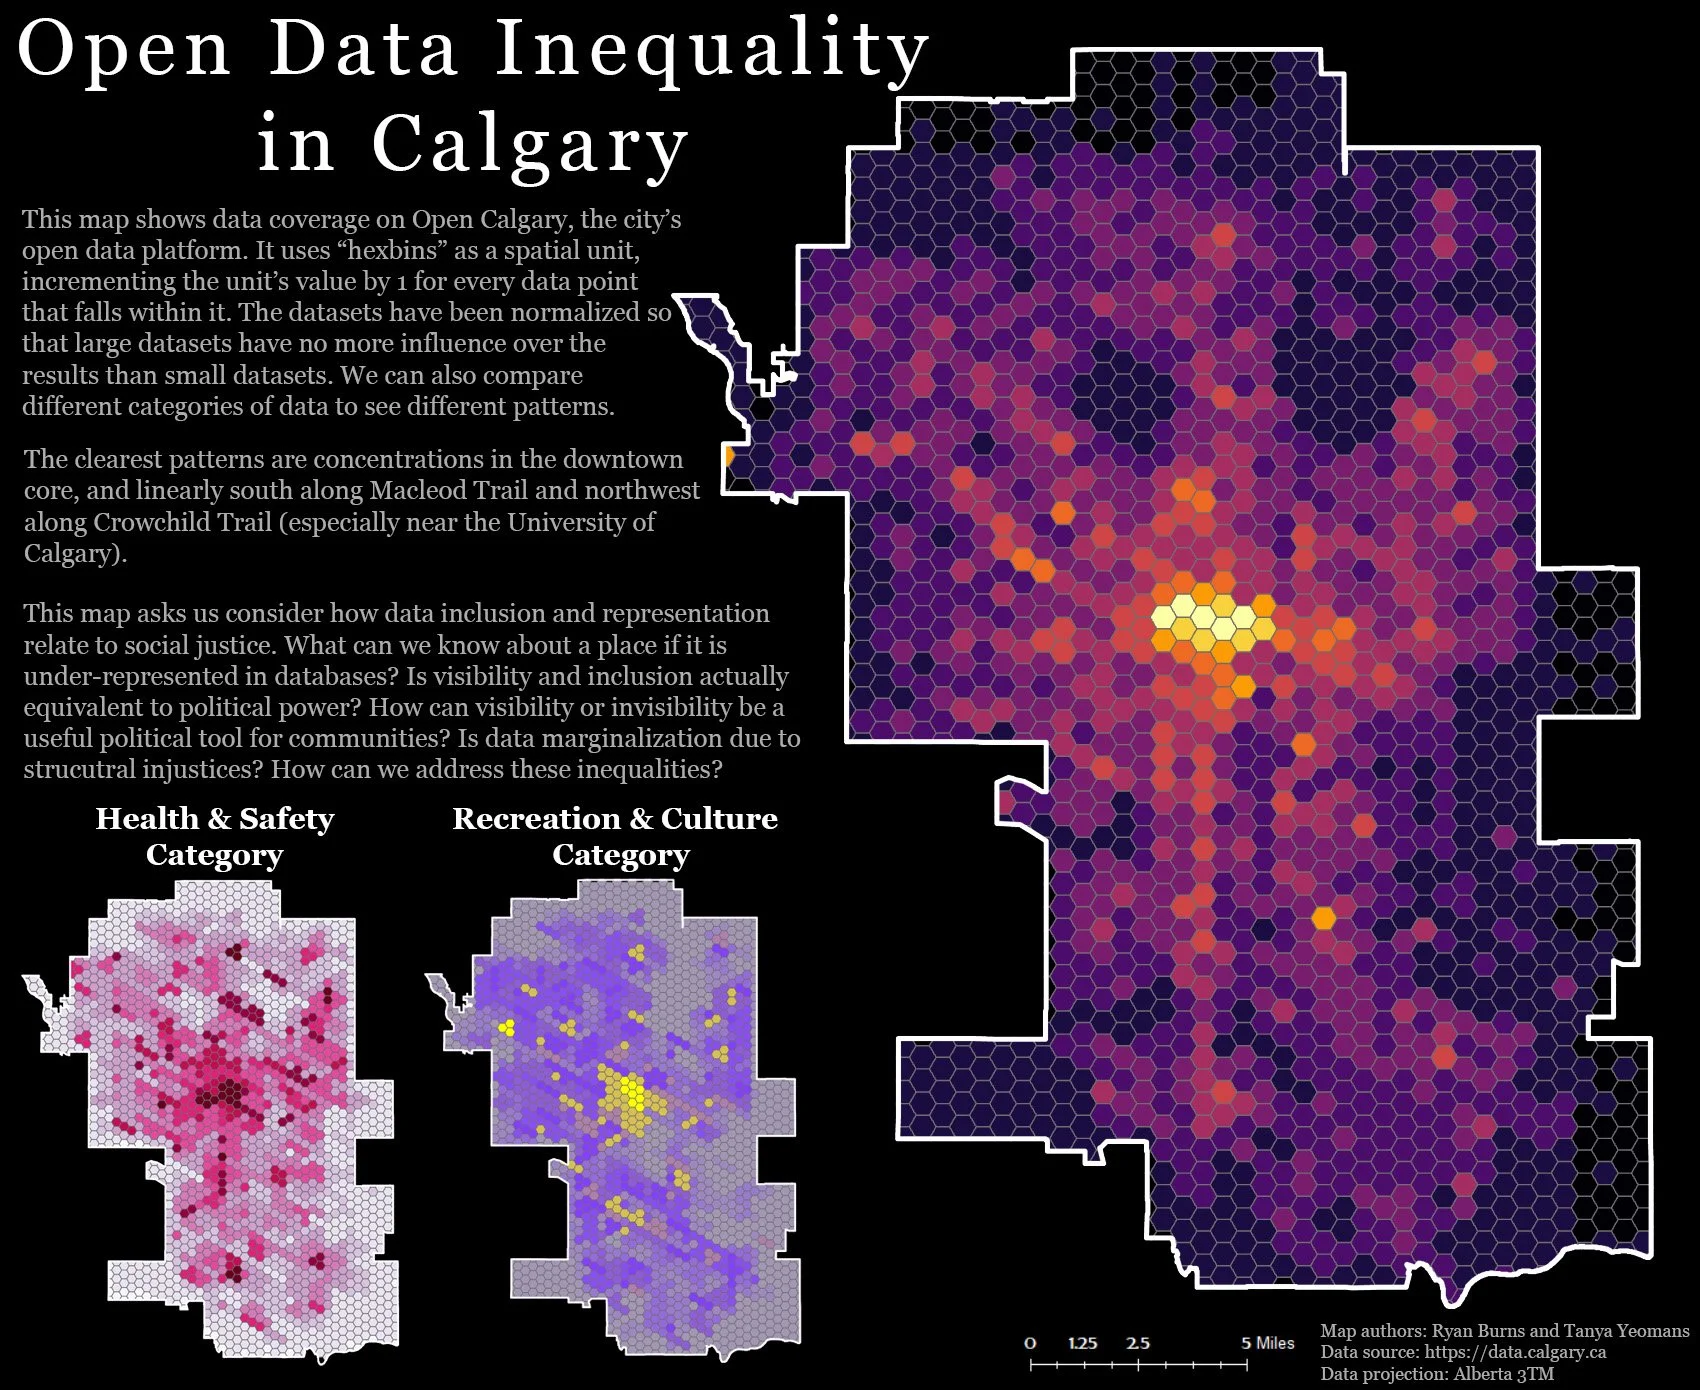
After our article was published, we were able to expand our analyses cartographically, to visualize the uneven coverage of Open Calgary. We were interested in what parts of the city of Calgary are represented in Open Calgary, and what those representations look like. Again, as part of our database ethnography, we generated a hexagonal lattice grid over the city, and on the most basic level, added up all the open data points that fall within each cell of the grid. We gave the resulting numbers a color ramp to indicate which areas of the city are more represented than others. This basic analysis faces a number of really trenchant limitations, so we have been experimenting with other ways of doing the math. We’ve normalized the datasets so that larger ones don’t disproportionately influence the outcomes; we’ve visualized by category; and we’ve begun to segment out datasets of similar temporal qualities like real-time waste management datasets versus demographic information. These analyses are in the very early stages and we have a lot of work to do before they’re scientifically sound, but we are excited to see where it takes us. At this stage, it seems to us that it will mobilize the database ethnography to generate even more insights into the remarkably uneven, unexpected, and under-acknowledged implications of open data.