Who Can I Sample on Amazon Mechanical Turk?
Amazon Mechanical Turk (MTurk) is an online microtasking site commonly used for behavioral research. At the same time, MTurk is an open marketplace. This means that the people who use MTurk as researchers and participants constantly change. An important question behavioral scientists often ask is: who is on MTurk and who can I sample there?

Research using MTurk book cover
Conducting Online Research on Amazon Mechanical Turk and Beyond
by Leib Litman and Jonathan Robinson is part of SAGE Publishing's
SAGE Innovations in Research Methods
seies.
In this blog, we provide an updated picture of who is on Mechanical Turk as potential research participants and how those people are both similar to and different from the US population as a whole. The data reported in this blog are from the CloudResearch database and appear in the newest book in SAGE’s Innovation in Methods Series, Conducting Online Research on Amazon Mechanical Turk and Beyond.
Who’s on Mechanical Turk?
Consistencies with the US Population
The population of Mechanical Turk resembles the US population fairly well when it comes to variables like gender, race and ethnicity, and income.
Gender Distribution
Women represent just under 51 percent of the U.S. population (Quick Facts, 2020), yet the sources of research participants used by behavioral scientists are often dominated by women. Women often comprise 70 or even 80 percent of undergraduate subject pools and online market research panels also skew toward women.
MTurk is more balanced. Approximately 57 percent of people on MTurk identify as a woman. However, because men are more active on the platform than women, the percentage of tasks completed by men and women is about even.
The story of gender becomes more complex when examining the percentage of men and women across age groups. The older people are on MTurk, the more likely they are to identify as a woman. As shown in Figure 1, men only represent about 30 percent of people aged 50 or older. This suggests that researchers may find it difficult to sample older men on Mechanical Turk.
Figure 1. Female participants across age on MTurk.

Race and Ethnicity
The racial and ethnic composition of people on MTurk matches the U.S. population fairly well. This means that researchers can gather samples that are more diverse than most traditional sources of research participants or selectively recruit members of minority groups.
Figure 2. The racial and ethnic distribution of people on MTurk and in the U.S. population.

Note:
N > 100,000. Following the approach of the U.S. Census, ethnicity (Hispanic or not) was asked as a separate question from race. Hence, percentages for race and ethnicity sum to greater than 100 percent.
Income
People’s income has several important implications for research because income is an important part of socioeconomic status. The income distribution on MTurk matches that of the U.S. population fairly well until household income passes $150,000 (Table 1). Within most income brackets, the difference between people on MTurk and the U.S. population is within a few percentage points. At the top of the distribution, however, there is a gap between people on MTurk and the general population.
Table 1. Annual household income for Mechanical Turk and the U.S. population.
Annual household income
MTurk (2020)
CPS (2018)
< $10k
6.31
5.93
$10k-$19,999
6.60
8.77
$20k-$29,999
11.67
8.66
$30k-$39,999
10.82
8.73
$40k-$49,999
11.02
7.80
$50k-$59,999
11.22
7.56
$60k-$69,999
7.94
6.69
$70k-$79,999
7.30
6.02
$80k-$89,999
5.06
4.98
$90k-$99,999
5.16
4.42
$100k-$149k
11.97
14.95
>$150k
4.92
15.47
Note: MTurk data is from Moss, Rosenzweig, Robinson, & Litman, 2020. CPS = Current Population Survey, the primary source of labor force statistics for the U.S. population. CPS data are based on 2018 income.
Differences from the US Population
People on MTurk differ from the US population as a whole in some ways that are important for researchers to understand. Most notably, people on MTurk are younger than the population as a whole. Variables that correlate with age like education, political views, and religion also differ from the US population.
Age
A persistent criticism of social science studies is researchers’ reliance on undergraduate students (e.g., Sears, 1986). Several people have asked, how well do college sophomores really represent “people” more broadly?
MTurk offers researchers access to a more diverse group of people when it comes to age. As shown in Figure 2, about 37 percent of people on MTurk are in their 30s, another 17 percent are in their 40’s, and roughly 11 percent are in their 50s. These numbers are better than college students but not fully representative of the population. The American National Election Studies (ANES) data in Figure 2 represent the US population. As shown, the difference between MTurk and the general population for people above age 60 is extreme. This age gap has important implications for sampling on platforms like MTurk. Often, when researchers need to gather a large sample of older adults it may be easier to use a market research panel.
As might be expected based on differences in age, people on MTurk differ from the US population on several variables that are associated with age. For example, people on MTurk are less likely to be married, to have children, or as we show next to be religious or hold conservative values.
Figure 3. The age of people on MTurk and in the U.S. population.

Religion
Most people in the US population are religious, but this is less true on MTurk. Close to 40% of people on MTurk describe themselves as Atheist or Agnostic. In the US population this number is just 7 percent.
Christians represent the largest religious group on MTurk followed by Jews and Buddhists. Like the overall US population, there are few Muslims on MTurk.
The religious profile of people on MTurk has at least two implications for research. First, when researchers want to sample members of a minority religious group, it may be best to use a market research panel where such participants are easier to find. Second, when an experimental effect depends on people’s level of religiosity, researchers should ensure that their sample contains enough religious respondents by using quotas.
Figure 4. The religious affiliation of people on MTurk and in the U.S. population.

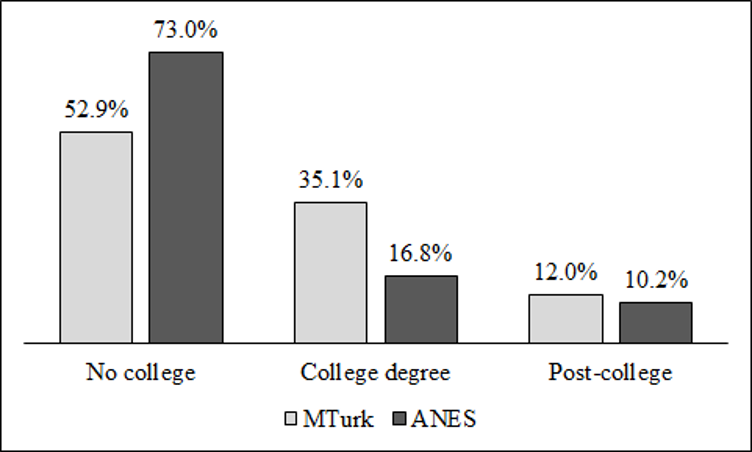
Education
People on MTurk tend to be well educated. Close to half of people hold a bachelor's degree or higher while this number in the U.S. population is only 27 percent. The division of MTurk into nearly equal segments of people with and without a college degree means that it is relatively easy to recruit participants with a variety of educational backgrounds.
Figure 5. The educational attainment of people on MTurk and in the U.S. population.
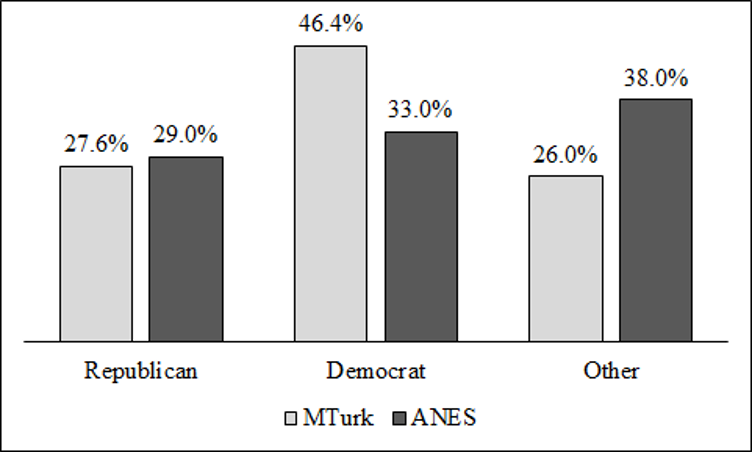
Political Affiliation
As might be expected based on people’s age and education, those on MTurk are more left-leaning politically than the US population. Just under half of people describe themselves as a Democrat. At the same time, however, about 28 percent of people describe themselves as a Republican and a large share of people describe themselves as Independents.
Figure 6. The political affiliation of people on MTurk and in the U.S. population.
Conclusion
In some respects, people on MTurk look like the U.S. population. The composition of gender, race and ethnicity, and income of people on MTurk mirrors the U.S. population. However, people on MTurk are younger than the U.S. as a whole, and as might be expected based on age, people are also more liberal, less religious, and more likely to identify as a member of the Democratic party.
To learn more about the demographics of people on MTurk—including geographic distribution, employment status, family composition, experience level on the platform, how often new people join the platform, activity patterns across time of day, and what percentage of HITs people from different demographic groups complete—see the newest book in SAGE’s Innovation in Research Methods series, Conducting Online Research on Amazon Mechanical Turk and Beyond or check out the CloudResearch Metrics tool, which gives an interactive view at the demographics of people on MTurk.
More on Mechanical Turk!
Studying Human Behavior During a Pandemic: MTurk | Leib Litman