Data in the News: Inequality Between the Sexes

Collecting, analyzing, and reporting with data can be daunting. The person that SAGE Publishing — the parent of MethodSpace — turns to when it has questions is Diana Aleman – editor extraordinaire for SAGE Stats and U.S. Political Stats. And now she is bringing her trials, tribulations, and expertise with data to you in this blog, Tips with Diana. Stay tuned for Diana’s experiences, tips, and tricks with finding, analyzing and visualizing data. View Diana’s blog in its native habitat HERE.
Despite the passage of the Civil Rights Act in the U.S. in 1964 that outlawed discrimination based on race, color, relation, sex or national origin, barely a day goes by without complaints that either men or women are being unfairly discriminated against. In fact, the debate around whether women are disadvantaged economically and socially has become one of the key debates in America’s culture wars these days.
In this blog post I want to show you how I used data to investigate this topic and different ways you can present and transform any data you collect to answer your research topic. I chose to examine male and female employment data in the finance industry because it’s an industry long stereotyped as a male-dominated industry with elements of “bro” culture.
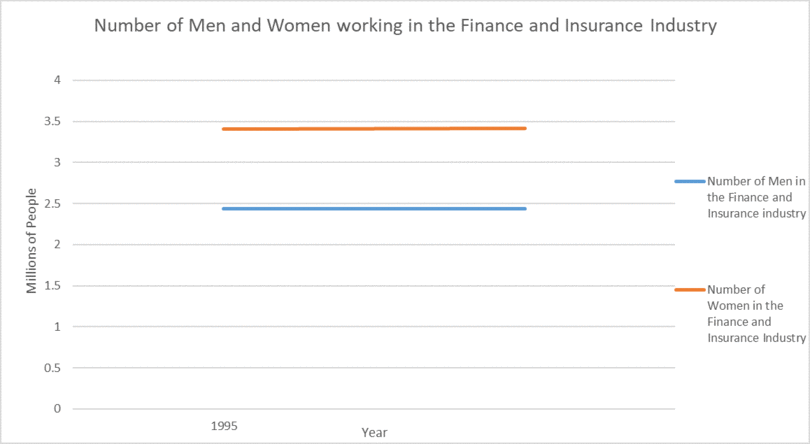
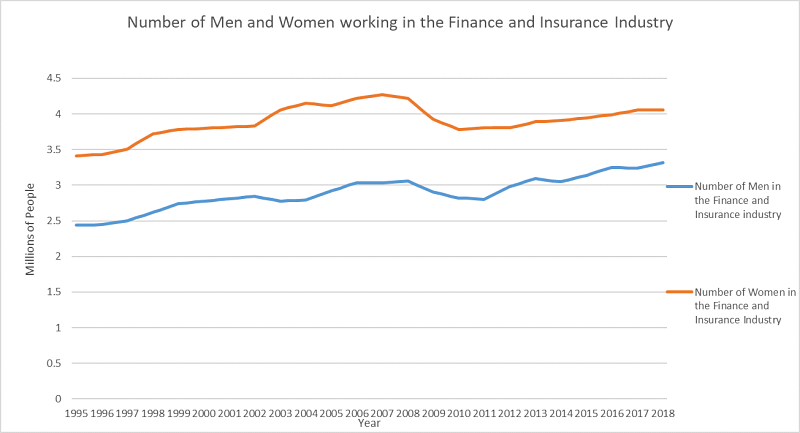
To find data on male and female employment within the finance industry I headed to the Bureau of Labor Statistics (BLS) and the reports from the Current Population Survey (CPS). The CPS has published an annual report on the number of women working in the Finance and Insurance industry, e.g. this is the 2016 report. For the sake of simplicity, I will refer to the Finance and Insurance as just “finance.” Now, the report doesn’t state out right how many men and women work in finance outright. It provides the percentage of women employed and the total number of people employed in finance in thousands. In 2016, 55.1 percent of 7,241 thousand finance employees were women. There are lots of statistics we can pull from this information. For instance, 7,241,000 multiplied by 0.551 gives you 3,989,791, the number of women working in finance. And if you know that 55.1 percent of people working in finance are women then you know that 44.9 percent of people working in finance in 2016 are men and can work out the exact number of men. I did this for every year 1995-2018 recording my results in an excel file to produce this graph.
Yes, it was time-consuming, but note that it didn’t require advanced math or even any special resources. All of this data was readily available for free on the BLS site.
The graph yielded some results that were surprising. Far from confirming that the finance and insurance industry is male-dominated, data from the BLS shows that the number of women working in the industry has been higher, roughly a million, since 1995. This graph however only charts the number of men and women working in the “finance and insurance” industry, which follows a specific definition and includes all types of financial and insurance occupations. Additionally, further research would need to be done on the average pay of men and women and the number of men and women in leadership positions to get a greater insight into whether men and women are treated equally in finance.
By complete accident the graph also reflected the state of the finance industry 1995-2018. Remember that when I set about collecting this data, I wanted to investigate gender discrimination in the finance industry. In 2008 you see a steep decline in the number of men and women employed in the finance industry as the global financial crisis hits and huge numbers of people working in finance lose their jobs. Additionally, you see a small decrease in the number of men working in finance in 2000-2004 due to the dot-com bubble, but interestingly the number of female employees actually increase during that time.
To better communicate this to any viewers of this graph, I created a gif so that readers can better understand how historical events are reflected in the data.