Novelty in the News: Detecting Innovation with Machine Learning

Every summer, the Biocomplexity Institute’s Social and Decision Analytics Division's Data Science for the Public Good (DSPG) Young Scholars program draws university students from around the country to work together on projects that use computational expertise to address critical social issues faced by local, regional, state or federal governments. The students conduct research at the intersection of statistics, computation, and the social sciences to determine how information generated within every community can be leveraged to improve quality of life and inform public policy. The program, held at the University of Virginia's Arlington offices, runs for 10 weeks for undergraduate interns and 11 weeks for graduate fellows who work in teams collaborating with postdoctoral associates and research faculty from the division, and project stakeholders.
The 2019 cohort conducted nine research projects, and their methodologies and discoveries will be presented at MethodSpace over the next three weeks as part of our examinations of Methods In Action. The descriptions of the projects were penned by the students themselves, and their names, mentors and sponsors appear under the DSPG logo in the text.
[su_box title="ABSTRACT - Detecting Pharmaceutical Innovations in News Articles Using Machine Learning" style="default" box_color="#333333" title_color="#FFFFFF" radius="3" class="" id=""]Company R&D and innovation is measured by NCSES and compared to countries around the world as indicators of economic competition and growth. The measurement is based on the annual Business R&D Innovation Survey. This project aims to develop machine learning techniques to assess the feasibility of measuring business innovation in the US pharmaceutical industry using non-survey data with focus on stories in newspapers, trade journals, newsletters, and other sources..[/su_box]
Innovation, from peanut butter to electricity, drives a country’s economic growth and is one of the foremost indicators of economic well-being around the globe. The National Center for Science and Engineering Statistics, a branch of the National Science Foundation, annually surveys the incidence of US-based innovation through the Business R&D and Innovation Survey, or BRDIS. To measure innovation, the National Center for Science and Engineering Statistics utilizes the Organisation for Economic Co-operation and Development’s Oslo Manual’s definition of innovation: the product must be new or significantly improved and the product be currently available on the market. While BRDIS broadly estimates how many companies produced an innovation each year, specific nuances are not well understood and deeper insight into quantitative and qualitative characteristics is needed. How many products are associated with a company’s innovation and what are these products? Are the products really novel or did a company simply replicate an existing product?
Data-Science_Public_Good-Logo
DSPG Students:
Quinton Neville, Raghav Sawhney
Mentors:
Devika Nair, Neil Alexander Kattampallil, and Gizem Korkmaz
Sponsor:
Gary Anderson, National Center for Science & Engineering Statistics at the National Science Foundation
This research aims to develop methods to supplement BRDIS and measure the quantity, degree, and temporal trends of product innovations. We developed machine learning methods to detect product innovations using publicly available news articles.
Data
The breadth of innovation, even when it is strictly defined by the Oslo manual, is vast, so the scope of the project was narrowed to the pharmaceutical and medical device industries. These industries appealed to our project goals for several reasons:
New drugs are strictly regulated by the FDA regulation.
New drugs are continuously launching to market.
FDA-approved drugs are our universe of eligible product-innovations.
Within the two industries, 2 million news articles from 2013 to 2018 were accessed from the Dow Jones’ Data News and Analytics data product to develop our innovation-detection models. These data contained 30+ features, including article text body, title, publisher, subject, company, and publication date.

Bar chart on left of most frequently-mentioned companies across 2015 articles. Bar chart on right of most frequently-sourced publishers across 2015 articles.
The figures above show the relative breakdown of company-mentions and publisher-sources for pharmaceutical articles from 2015. We observe the disproportionate representation of some entities in the data. The companies mentioned in the articles strongly favored non-pharmaceutical companies, such as the US Securities & Exchange Commission (SEC), the Food & Drug Administration (FDA), and the NASDAQ stock exchange. Similarly, NewsRX and Dow Jones are disproportionately represented as publishers in the dataset.

Company co-mentions in 2015 articles, where co-mentions between nodes exceeded 150 appearances.
The network above visualizes DNA articles’ company co-mentions in 2015, using a subset of DNA articles filtered referencing innovation keywords. The graph shows 43 nodes and 113 edges, which, for illustrative purposes, do not include edges from the subset that occur fewer than 150 times. Node sizes and edge weights represent degree centrality and number of occurrences of co-mentions, respectively.
Exploratory data analysis ultimately revealed some potential biases in the data, indicating some skew in the data towards financial or regulatory news publishers with the greatest output or easiest accessibility. The network illustrates the centrality of the FDA and SEC to the various entities as well as the significant presence of private banking companies in the articles.
Methods
After wrangling these semi-structured data into a cohesive format, the process of building predictive models for article text classification (innovation Y/N) involved 5 key steps, laid out below in Table I with relevant details.
Step
Approach
Details
Access
Utilized two methods of labeling training data:
M1
–Human labeled articles for innovation
M2
– DNA labeled articles for new product/service
n = 1000 articles random sample randomly assigned to training (80%) and testing (20%) sets
Prepare
Text processing step Bag of Words: Transform articles to a document-term matrix of word frequency Dimensionality reduction step: Feature selection: Least Absolute Shrinkage and Selection Operator (LASSO)
Train
Supervised Machine Learning Penalized Logistic RegressionRandom ForestGradient Boosting Machine (Trees)Support Vector MachinesBERT Neural Network Unsupervised Machine Learning
k-
Means clustering
Hierarchical ClusteringBayesian Hierarchical ClusteringLatent Dirichlet Allocation
Tuning – optimized model parameters with 5-fold Cross Validation
Optimize
Probability threshold for binary classification
Select optimal threshold via minimization of false-negative averse cost matrix
Assess
Metrics Receiver Operator Characteristic (ROC) CurvesArea Under the Curve (AUC)AccuracyPrecision Bootstrap “Out-of-Bag” Validation
Table I. Outline of methods used to develop predictive models.
Results
First, all unsupervised methods elicited poor prediction performance and Support Vector Machines failed to appropriately converge. Apart from Latent Dirichlet Allocation, which is a widely used method in topic-modeling in text analysis, results for these methods are omitted here.
Comparing the remaining supervised models across a variety of metrics, the BERT neural network performed exceptionally well for identifying articles which DNA labeled as concerning a new product, but such high performance was not mirrored for classifying innovation articles (Table I). The methods involving decision trees, Random Forest and Gradient Boosting Machines, consistently performed well with high ROC and accuracy (Table I, Figure ROC). Penalized Logistic Regression, considered a baseline model by performance here, was consistent but did not perform as well as the previous methods. Finally, Latent Dirichlet Allocation was found to be slightly better than flipping a weighted coin where the probability of a positive response corresponds to the proportion of positive articles in the training data, while Support Vector Machines had convergence issues and results were not obtained.
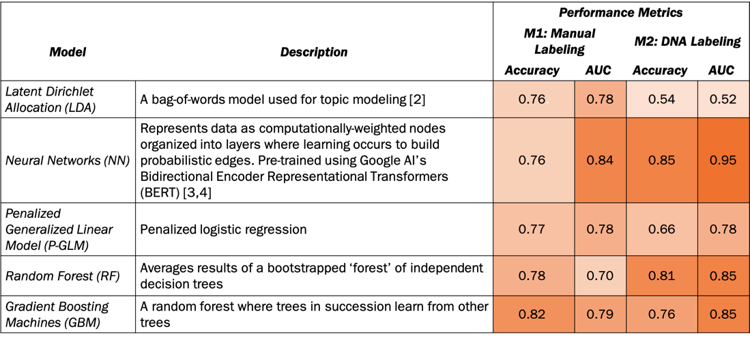
Performance metrics of supervised models against two sets of labeled DNA articles, manually-labeled and commercially-labeled. Manual labels were generated via survey to indicate whether an article described a new product; DNA labels were generated via the company’s own proprietary mechanism, a combination of sorting rules, machine-learning, and human input.
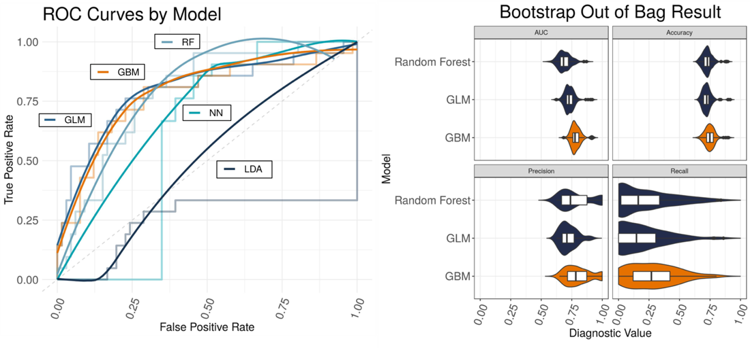
ROC curves plotted with smoothed curves. LDA shows weakest performance; GBM and NN show strongest performance by accuracy and AUC. 3B. Violin plot for bootstrap out-of-bag results. GBM shows greatest performance by AUC and recall.
Following the results from the Bootstrap “Out-of-Bag" metrics, we observed that Gradient Boosting Machines were optimal models for identifying innovation across all metrics, while Random Forest and Logistic Regression were comparable but less attune to finding patterns in the text that indicated innovation. Considering each model in conjunction with corresponding diagnostics, our recommendation is the use of BERT for identifying new product or service articles (as defined by DNA) and Gradient Boosting Machines for innovation due to above 80% accuracy, robust precision – recall tradeoff, and high AUC by ROC.
Discussion
Text classification is no simple task. Different publications boast different syntax, writing style, verbiage, and structure, with trends changing over time. Wading through a mire of news articles requires methods which can reduce the dimensionality of word usage and identify key words or phrases that indicate the outcome of choice, accounting for variability in authorship between articles and publishers.
We identified two robust, highly performing methods to identify both innovation and new products or services in Gradient Boosting Machines and BERT Neural Networks, respectively. While these methods were restricted to a small sample of a much larger wealth of data, they provide a strong platform for the further exploration and identification of innovation in the pharmaceutical industry. Ultimately, the NCSES seeks to quantify and qualify innovation across all industries. The work presented here illustrates a proof of concept, that the consideration of publicly available news articles as an information source is an effective tool to capture innovation. Once these methods are used to detect news articles mentioning innovation, one can extract the company and product names from the articles and develop innovation metrics. Moreover, features of the products could also be extracted with advanced methods, which would supplement the information collected by BRDIS.
Moving forward, as unsupervised machine learning methods (which do not rely on a priori labeled articles) were found to be insufficient predictors for innovation, this necessitates the creation of a robust survey to dissect the ontological structure present in these news articles for supervised prediction. The BERT neural network is also a relatively novel method and will be investigated further as it presents a more flexible classification methodology than any other method investigated here. NCSES, in conjunction with the lab, will undertake the arduous task of extracting company and product names to generate and analyze the interconnected network of innovation production. In a complex world, many moving pieces contribute to and drive the quantity and quality of innovations within the country. Applications for the groundwork we have laid for predicting innovation from publicly available sources are nearly endless. With the groundwork laid and a clear goal in mind, the team will continue to fine-tune the technical machinery, extend this methodology to other industries, and develop with NCSES a suitably innovative and dynamic tool to measure and understand innovation.