Image as data: Automated visual content analysis for social science
By Jungseock Joo and Zachary C. Steinert-Threlkeld
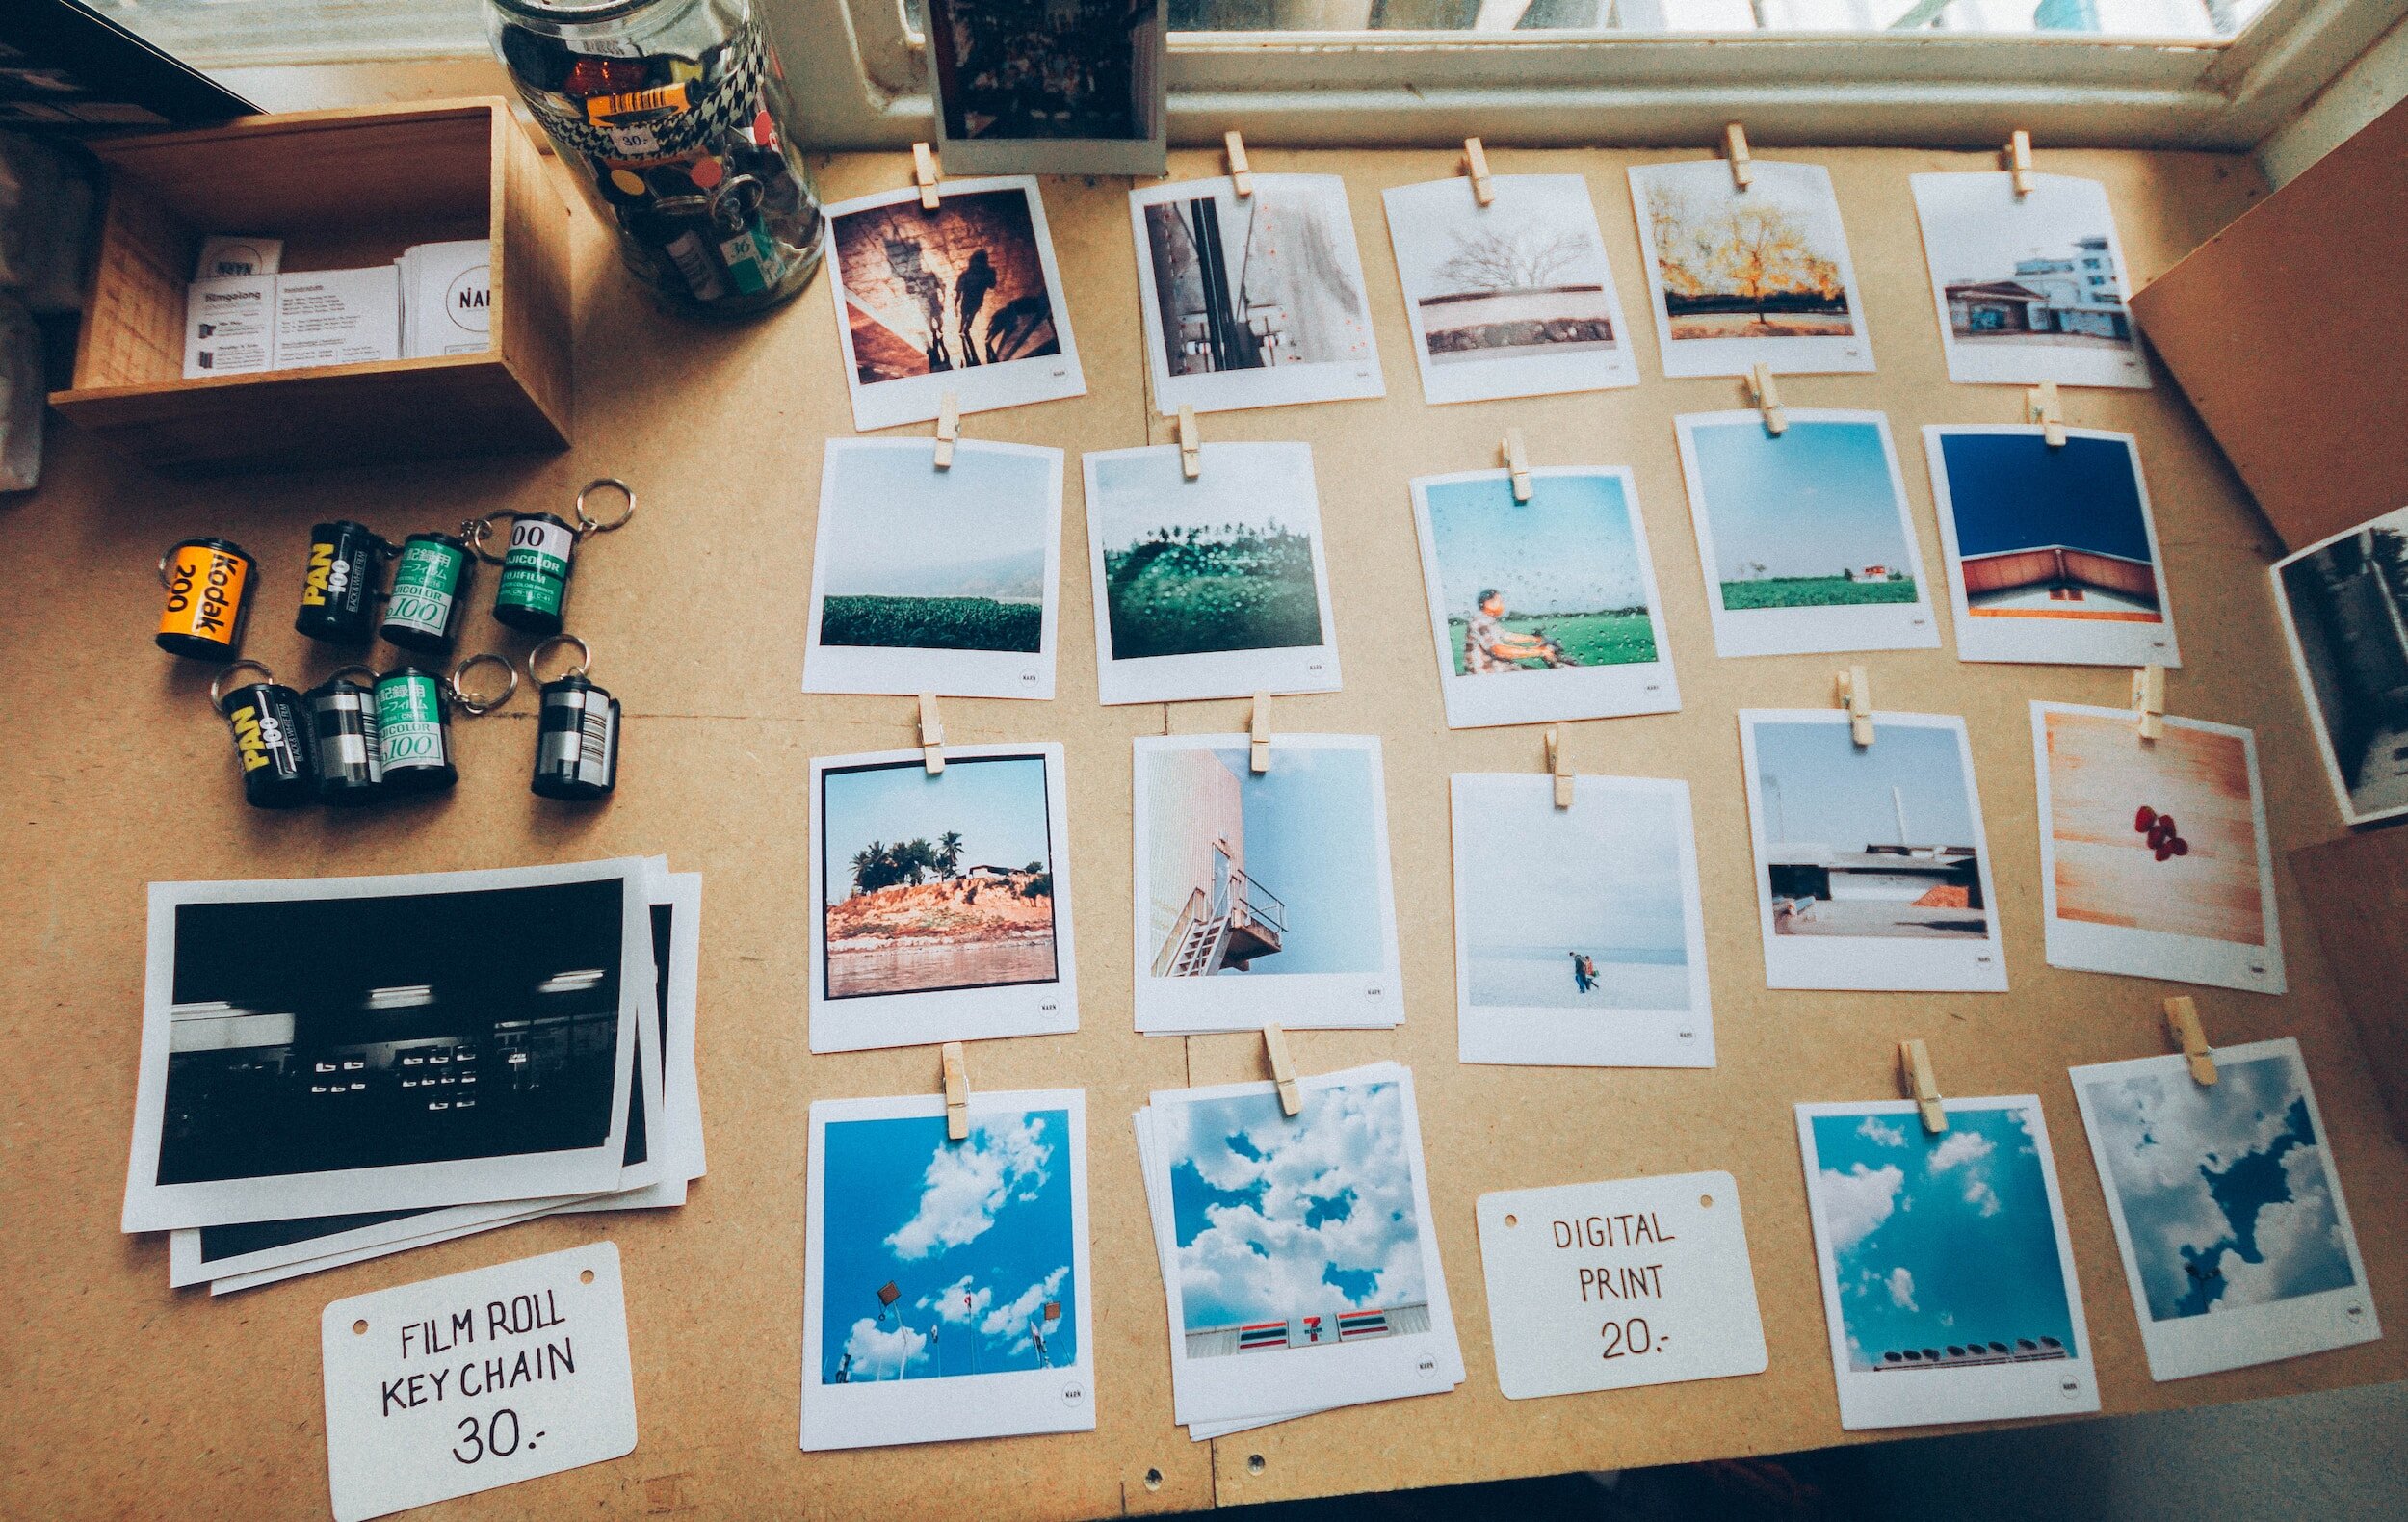
Images contain information absent in text, and this extra information presents opportunities and challenges. It is an opportunity because one image can document variables with which text sources (newspaper articles, speeches or legislative documents) struggle or on datasets too large to feasibly code manually. It has been a challenge because of the technical difficulty of identifying the objects and concepts encoded in an image, requiring researchers to rely on manual coding. Because human coders are slow, expensive and have different interpretations of the same images, studies using images have historically been small. The falling cost of computing, coupled with the availability of large datasets, means these techniques will become mainstream shortly. Our research focuses on hastening that process, and the purpose of this blog post is to provide a very high-level overview of images as data.
For more detail than is provided below, please see our working paper, “Image as Data: Automated Visual Content Analysis for Political Science”, available on Cornell University’s research repository for computer sciences, arXiv.
Why study images?
Images are of interest for two reasons: (1) they are key inputs into individual decision-making and (2) can provide improved data to advance research agendas.
Humans are more likely to notice and learn from visual information than textual. Images provide information about a situation, such as a politician’s patriotism or the beneficiaries of a new healthcare policy, more accessibly and quickly than text. Moreover, emotional reactions often drive human behavior, and visuals evoke these reactions more strongly than text. Images encapsulate underlying, complex issues, providing an information shortcut for individuals to evaluate multi-faceted political issues.
Images can also provide data that advance research agendas. For example, they can provide demographic and socioeconomic information about individuals and places when surveys are not available. They provide measures of economic development in places that otherwise have unreliable data or are not measured frequently. They can also generate more precise measures of concepts of theoretical interest, such as how violent or large a protest is. At the end of the post, we briefly show how images provide data about theoretical concepts of interest, such as repression and dissent, that text struggles to provide.
Tasks in computer vision
Image classification, object detection, and face and person analysis are the three tasks in computer vision most useful to social scientists.
Image classification
Given an input image, the goal of image classification is to assign a label based on the image content. Classification can be binary or multinomial (“multiclass” in other contexts). In multiclass classification, Y contains more than two categories. The Softmax function is commonly used in multiclass classification to normalize output scores over multiple categories such that the final scores sum to one as a probability distribution (i.e., multinomial logistic regression).
Object detection
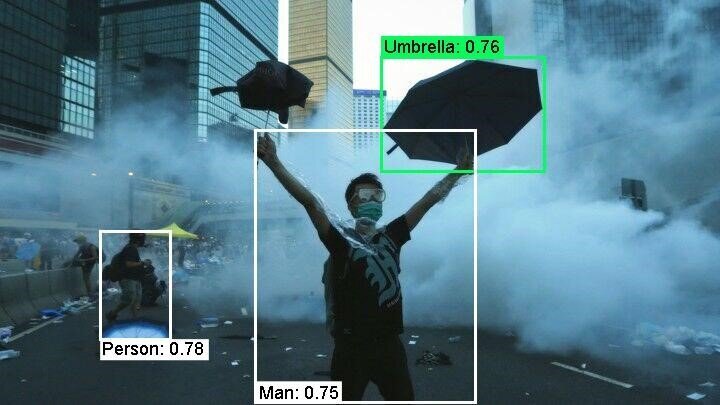
Figure 1: Example results of object detection, using Google’s Cloud Vision API
The goal of object detection is to find (localize) objects in images and assign a category (guns, flags or poses, for example) to each object. The output of object detection is a set of detected objects, their locations and categories. Figure 1 shows example results of object detection with detection scores, using Google’s Cloud Vision API.
Face and person
Face detection refers to finding the location of every face in an input image. This is a special case of object detection where only one object category (face) is considered. Face recognition classifies the identity of a person from a facial image. Face recognition models are either part-based or holistic. In part-based approaches, different facial regions, such as the forehead or mouth, are detected and modeled separately, and the local features from multiple regions are combined for final classification. In holistic approaches, the appearance of a whole facial region is directly modeled without part detection. A face provides clues for recognizing demographic variables (e.g., gender, race and age), emotional states, expressions, and actions, commonly referred to as human attributes in computer vision. While faces are usually the most reliable source for human attribute classification, other body cues, such as clothing, can further enhance the accuracy of human attribute classification. Some methods, therefore, attempt to detect body parts, extract pieces of evidence from local regions and merge multiple cues to make a final decision. Such an approach is also helpful when a face is occluded or not visible.
Training
New models can be built from scratch or customized from already trained (“pre-trained”) ones. Customization is commonly called transfer learning and significantly reduces the cost of building models. It is the approach we recommend for social scientists, as many sophisticated architectures trained on millions of images already exist. Transfer learning allows the social scientist to focus on collecting an adequate set of training images, not tweaking hyperparameters of models and waiting months for them to run.
Transfer learning works because convolutional neural networks, especially in their lower layers, capture features that can transfer and generalize to other related tasks. In visual learning, these sharable representations include elementary features such as edges, color or some simple textures. Since these features can commonly apply to many visual tasks, one can simply reuse what has been already trained from a large amount of training data and refine the model to the new data.
There exist many pre-trained models that are widely adopted as a baseline for fine-tuning, such as ImageNet, Places365 and VGG-Face. As their names suggest, these models are trained from data in specific domains: objects, places, and faces. Therefore, one can choose a model pre-trained for a task and domain related to the researcher’s question.
Whether using transfer learning or making a new model, it is critical to ensure that the training data represent a diverse and balanced set of images before they are annotated so that recall is high for each desired label. For example, if one wants to collect images to be used for training a protest event classifier, the set should contain enough protest images and non-protest images. This task may not be trivial if the target event infrequently occurs.
Validation
Deep neural networks often receive criticism due to the lack of interpretability of their results and internal mechanisms compared to simple models with a handful of explanatory variables. A deep model typically comprises millions of parameters (weights on edges between nodes), and it is impossible to identify their meanings or roles from the classifier output. One method of validation is to use a validation dataset that does not overlap with the training set. As in other classification problems, the accuracy can be measured by several metrics, including raw accuracy, precision and recall, average precision, and many others. These measures, however, do not explain how the model achieves its results.
Just as humans use language to explain a concept, one can develop a joint model that incorporates visual and textual data such that the text part explains its visual counterpart.
Another way of understanding how a deep network produces its output is through visualizations. Since convolutional neural networks are largely used for visual learning from images, visual validation is especially effective. The two most common methods are deconvolutional networks and Gradient-weighted Class Activation Mapping.
Example: Computer vision to measure protests
Images are obtained from geolocated tweets that we have collected in real-time. We find tweets from periods of interest, download all images from those tweets, and then apply two convolutional neural networks for image classification and person attribute recognition tasks. This analysis was performed using one desktop computer with one graphical processing unit.
While our paper has much more extensive results, we show here three figures that provide face validity to using images to measure protest.

Figure 3: Average state violence in photos from Kiev, Ukraine

Figure 4: Distribution of protester age
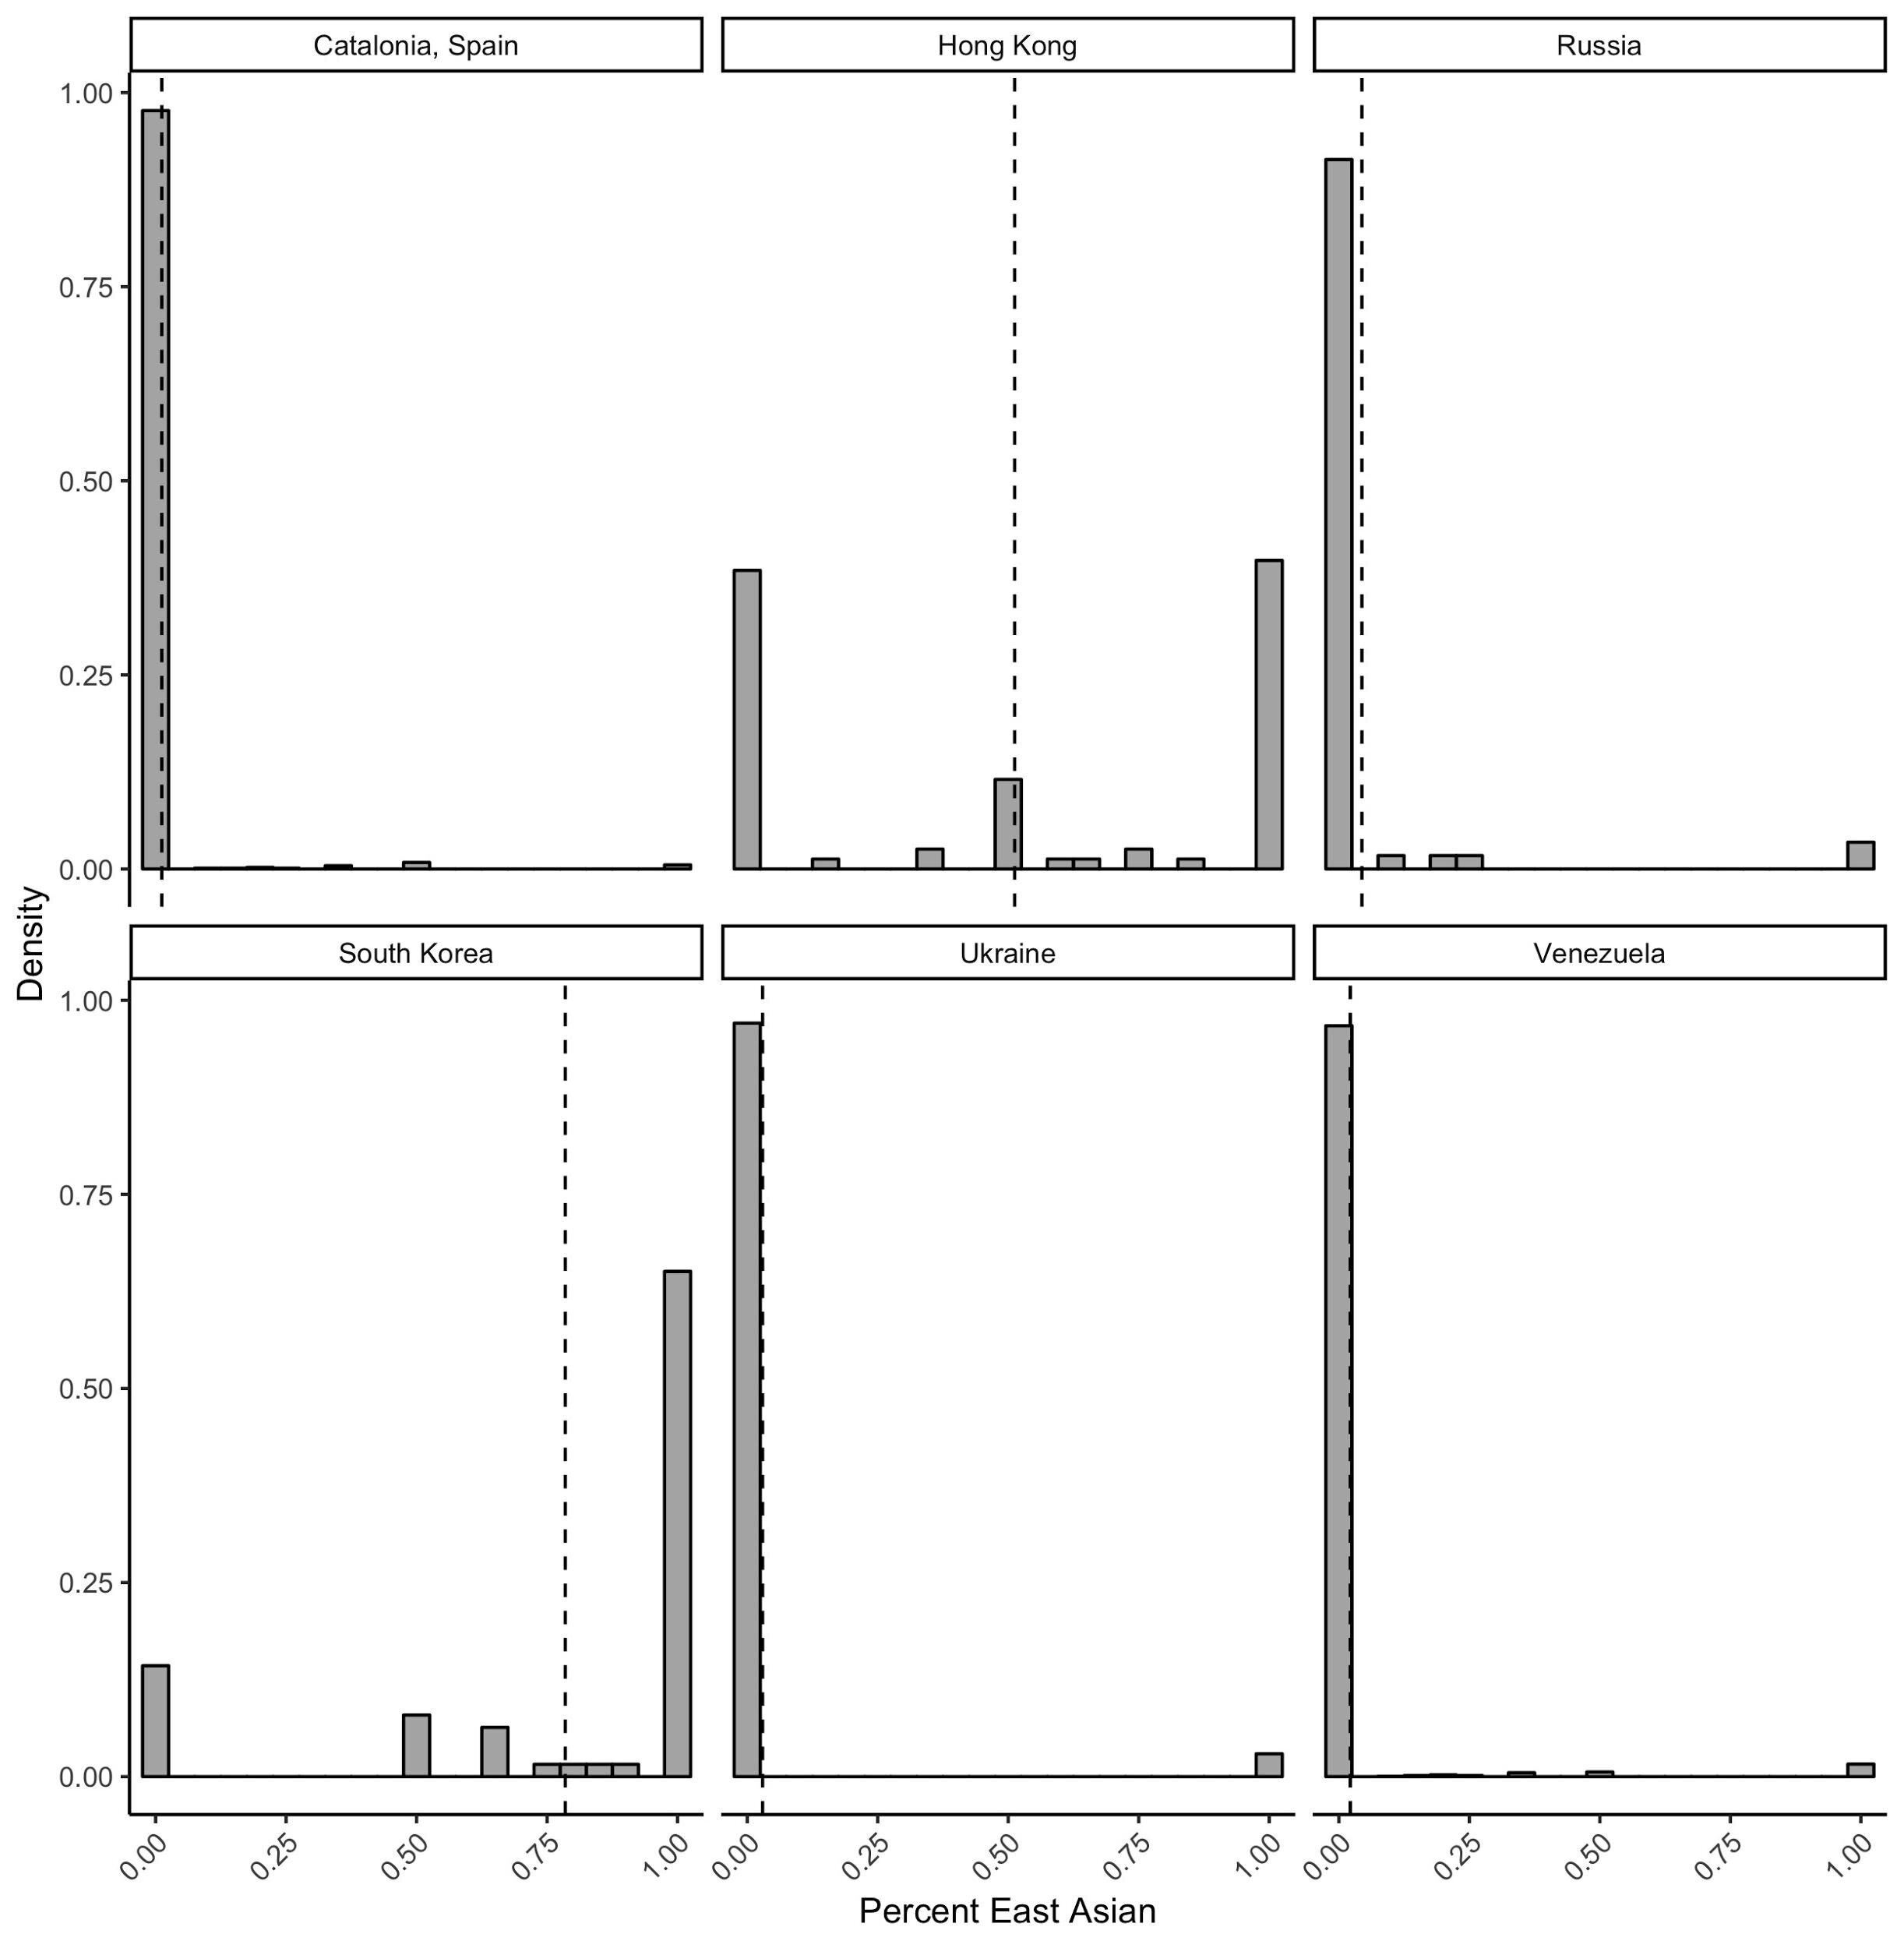
Figure 5: Distribution of protester race (percent of East Asian faces per photo)
Conclusion
Modern visual communication occurs at a scale too voluminous to rely on human coding. The website Internet Live Stats estimates that Instagram receives 1,000 new images per second. Our work has found that about 10% of tweets contain images or 579 images per second. Visuals also dominate newer platforms such as Snapchat and TikTok, as well as YouTube. It, therefore, behooves researchers who want to analyze what is happening on these platforms, as well as what those images reveal about offline events, to become familiar with the techniques just outlined.
About the researchers
Zachary C. Steinert-Threlkeld is an Assistant Professor of Public Policy at the University of California, Los Angeles’ Luskin School of Public Affairs. He uses computational methods to study protest dynamics, with a particular interest in how social networks affect individuals’ decision to protest. Using text analysis he has studied mobilization during the Arab Spring, information warfare in Ukraine, and activists’ online strategies. His work with images measures how violence, social cleavages, and free riding affect protest dynamics. Other work includes simulations of protest diffusion and studying how governments attempt to influence individuals’ online behavior.
Jungseock Joo is an Assistant Professor in Communication at University of California, Los Angeles. His research primarily focuses on understanding multi-modal human communication with computer vision and machine learning based methods. In particular, his research employs various types of large scale multi-modal media data such as TV news or online social media and examines how multi-modal cues in these domains relate to public opinions and real world events. His research has been supported by National Science Foundation, Hellman Foundation, and UCLA Faculty Career Development Award. He received Ph.D. in Computer Science from UCLA, M.S. in Computer Science from Columbia University, and B.S. in Computer Science and Engineering from Seoul National University. He was a research scientist at Facebook prior to joining UCLA in 2016.