


Interview with Daniela Duca on creating SAGE Texti: A free tool for cleaning and pre-processing textual data
Learn about a new free tool from SAGE!

Six new software tools supporting research methods in the social sciences awarded SAGE Concept Grants
Learn about new technologies for researchers!

SAGE Concept Grants: Advice for applicants
Interested in applying for a SAGE Concept Grant? We’ve put together the following advice for applicants based on our feedback for previous years’ applicants, and the criteria we’ll be using to judge this year’s applications.

Sociocultural Frameworks as a Humanizing Research Tool (Part 2)
Read part 2 of the series about humanizing methodologies by William Thomas.

Sociocultural Frameworks as a Humanizing Research Tool in contextualizing Black Male Teacher Retention
This series of MethodSpace posts by William Thomas will introduce a blueprint to developing a humanizing research methodology.
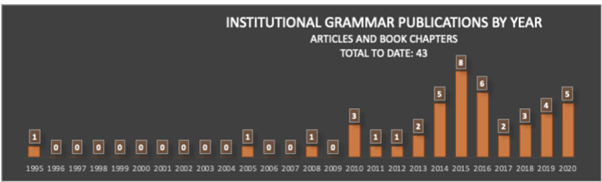
Understanding institutions in text
Institutions — rules that govern behavior — are among the most important social artifacts of society. So it should come as a great shock that we still understand them so poorly. How are institutions designed? What makes institutions work? Is there a way to systematically compare the language of different institutions? One recent advance is bringing us closer to making these questions quantitatively approachable. The Institutional Grammar (IG) 2.0 is an analytical approach, drawn directly from classic work by Nobel Laureate Elinor Ostrom, that is providing the foundation for computational representations of institutions. IG 2.0 is a formalism for translating between human-language outputs — policies, rules, laws, decisions, and the like. It defines abstract structures precisely enough to be manipulable by computer. Recent work, supported by the National Science Foundation (RCN: Coordinating and Advancing Analytical Approaches for Policy Design & GCR: Collaborative Research: Jumpstarting Successful Open-Source Software Projects With Evidence-Based Rules and Structures ), leveraging recent advances in natural language processing highlighted on this blog, is vastly accelerating the rate and quality of computational translations of written rules.

text: An R-package for Analyzing Human Language
In the field of artificial intelligence (AI), Transformers have revolutionized language analysis. Never before has a new technology universally improved the benchmarks of nearly all language processing tasks: e.g., general language understanding, question - answering, and Web search. The transformer method itself, which probabilistically models words in their context (i.e. “language modeling”), was introduced in 2017 and the first large-scale pre-trained general purpose transformer, BERT, was released open source from Google in 2018. Since then, BERT has been followed by a wave of new transformer models including GPT, RoBERTa, DistilBERT, XLNet, Transformer-XL, CamemBERT, XLM-RoBERTa, etc. The text package makes all of these language models and many more easily accessible to use for R-users; and includes functions optimized for human-level analyses tailored to social scientists.

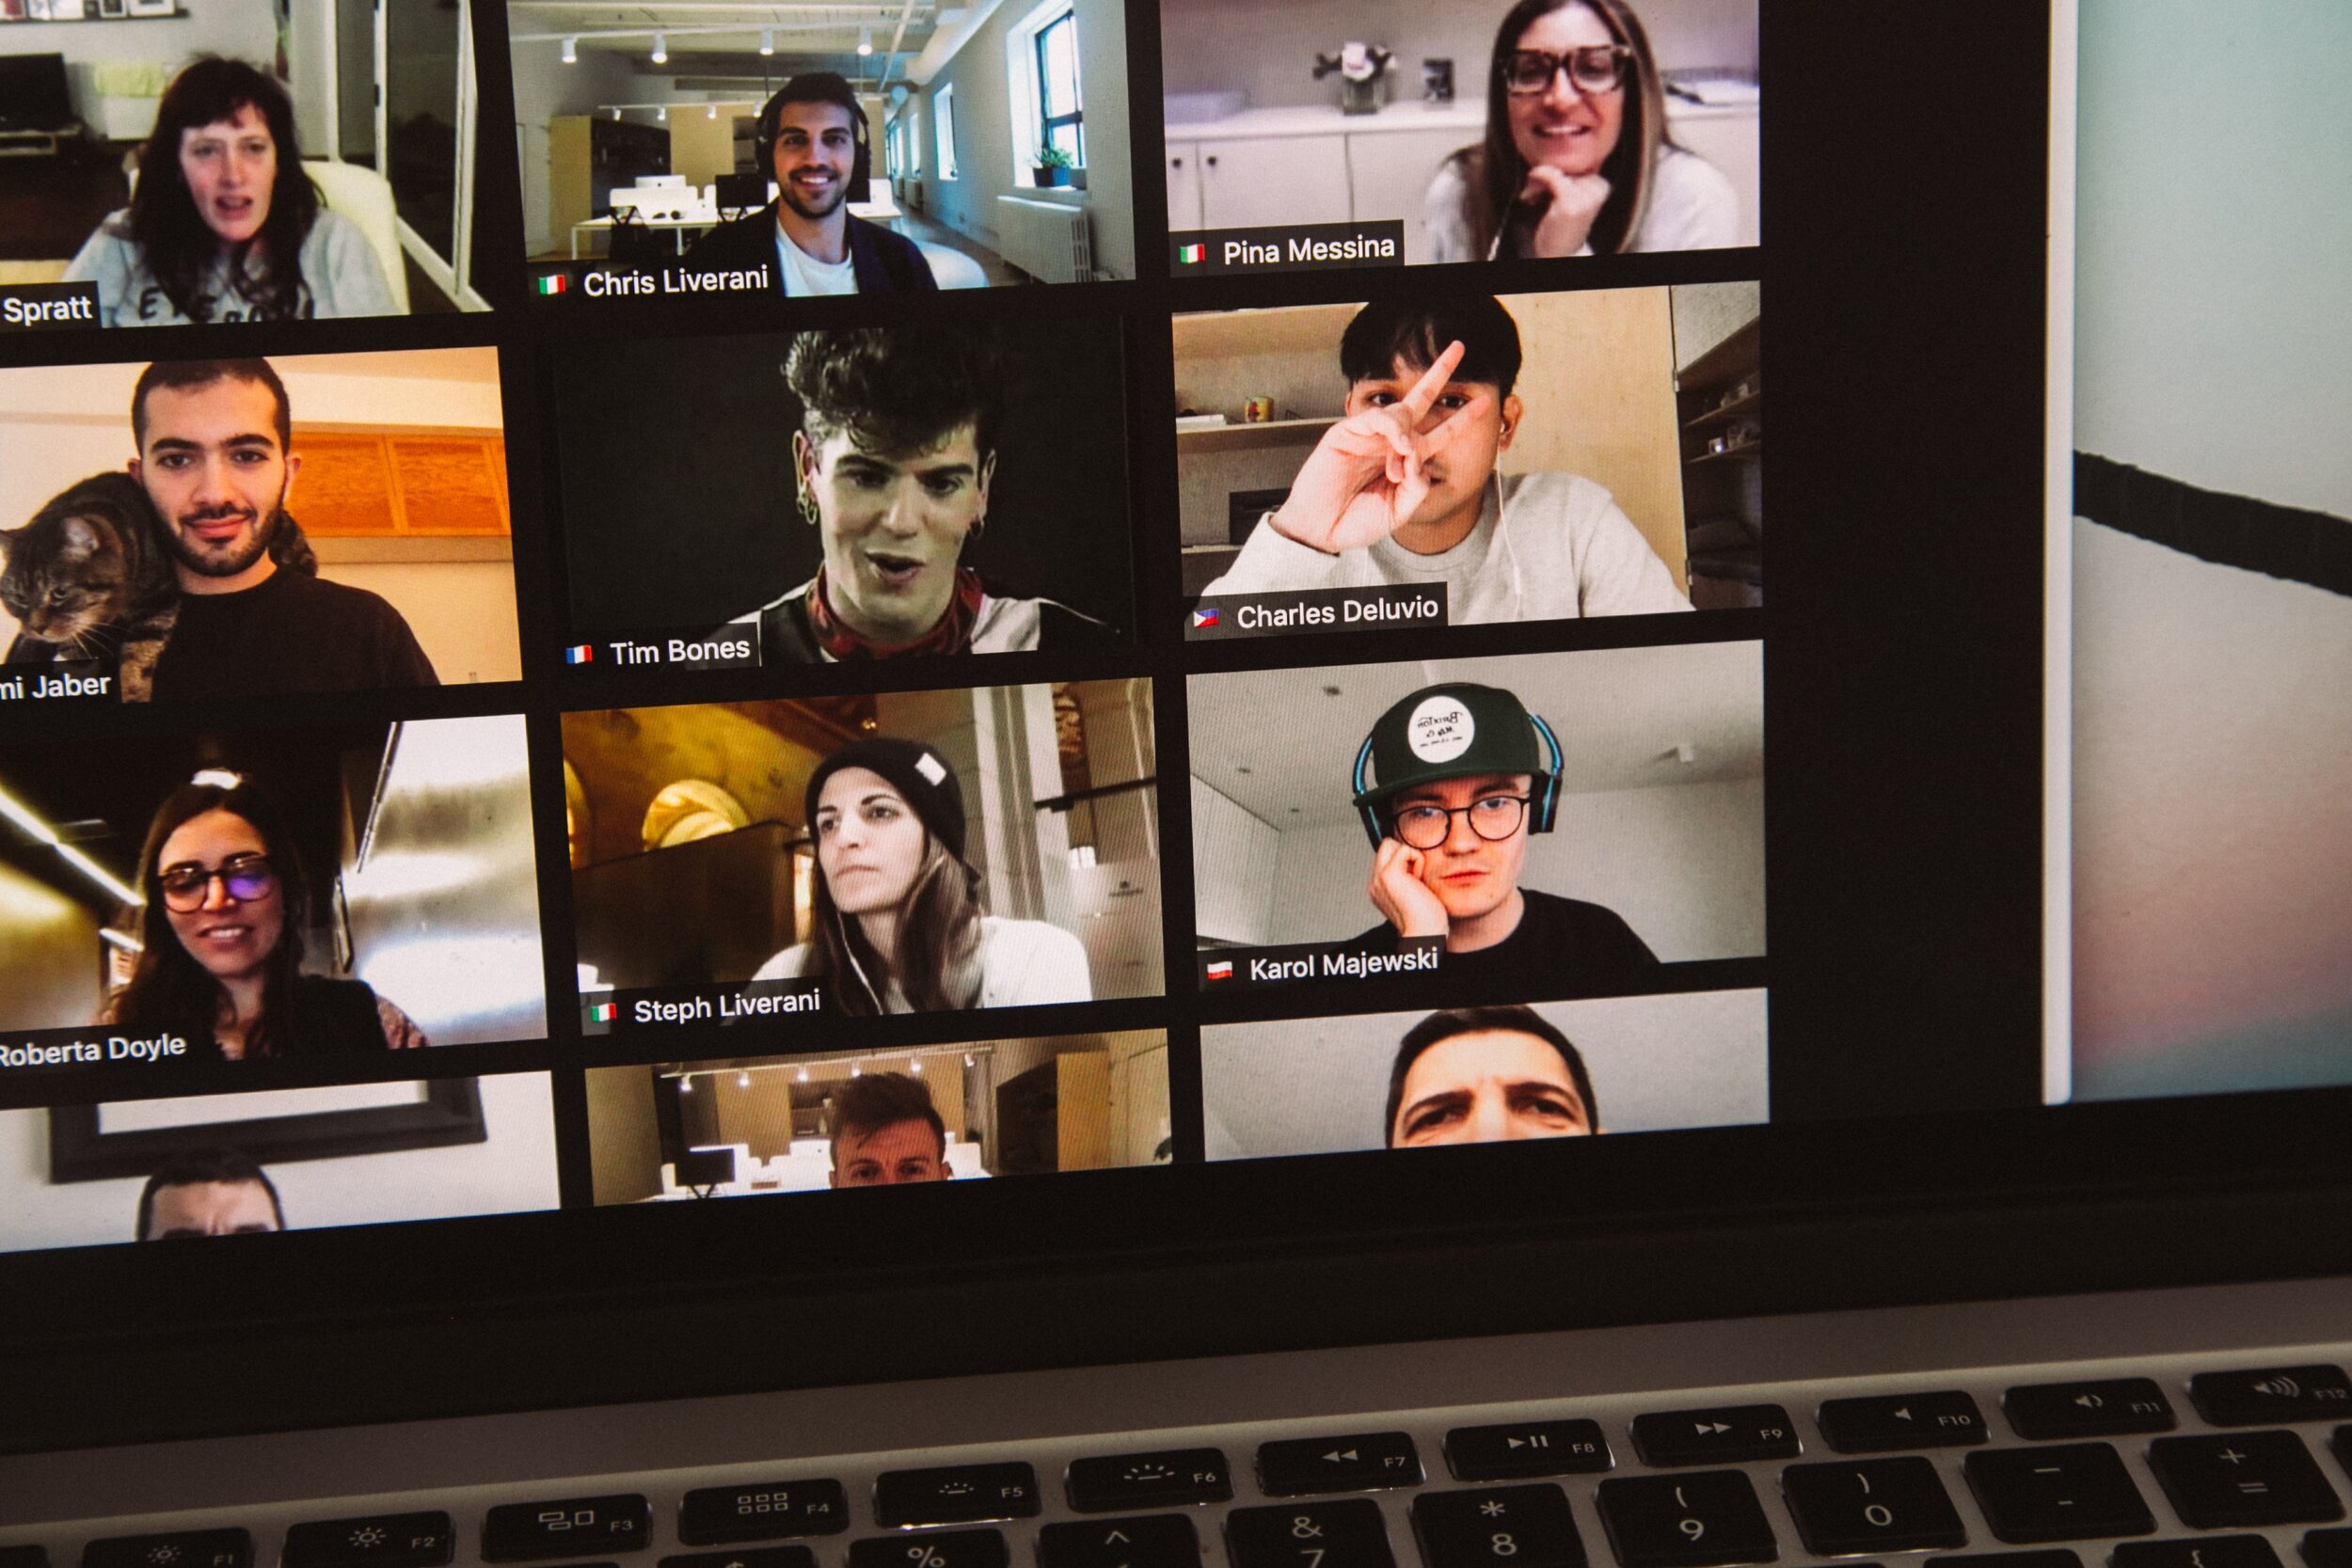
The challenges of running social science experiments from home - and 14 tools that can help
A growing number of social science researchers are shifting to digital methods, but it’s not an easy task, and this has been even more evident in lockdown. We’ve selected 14 software tools that you can start using immediately to run your social or behavioral experiments online.
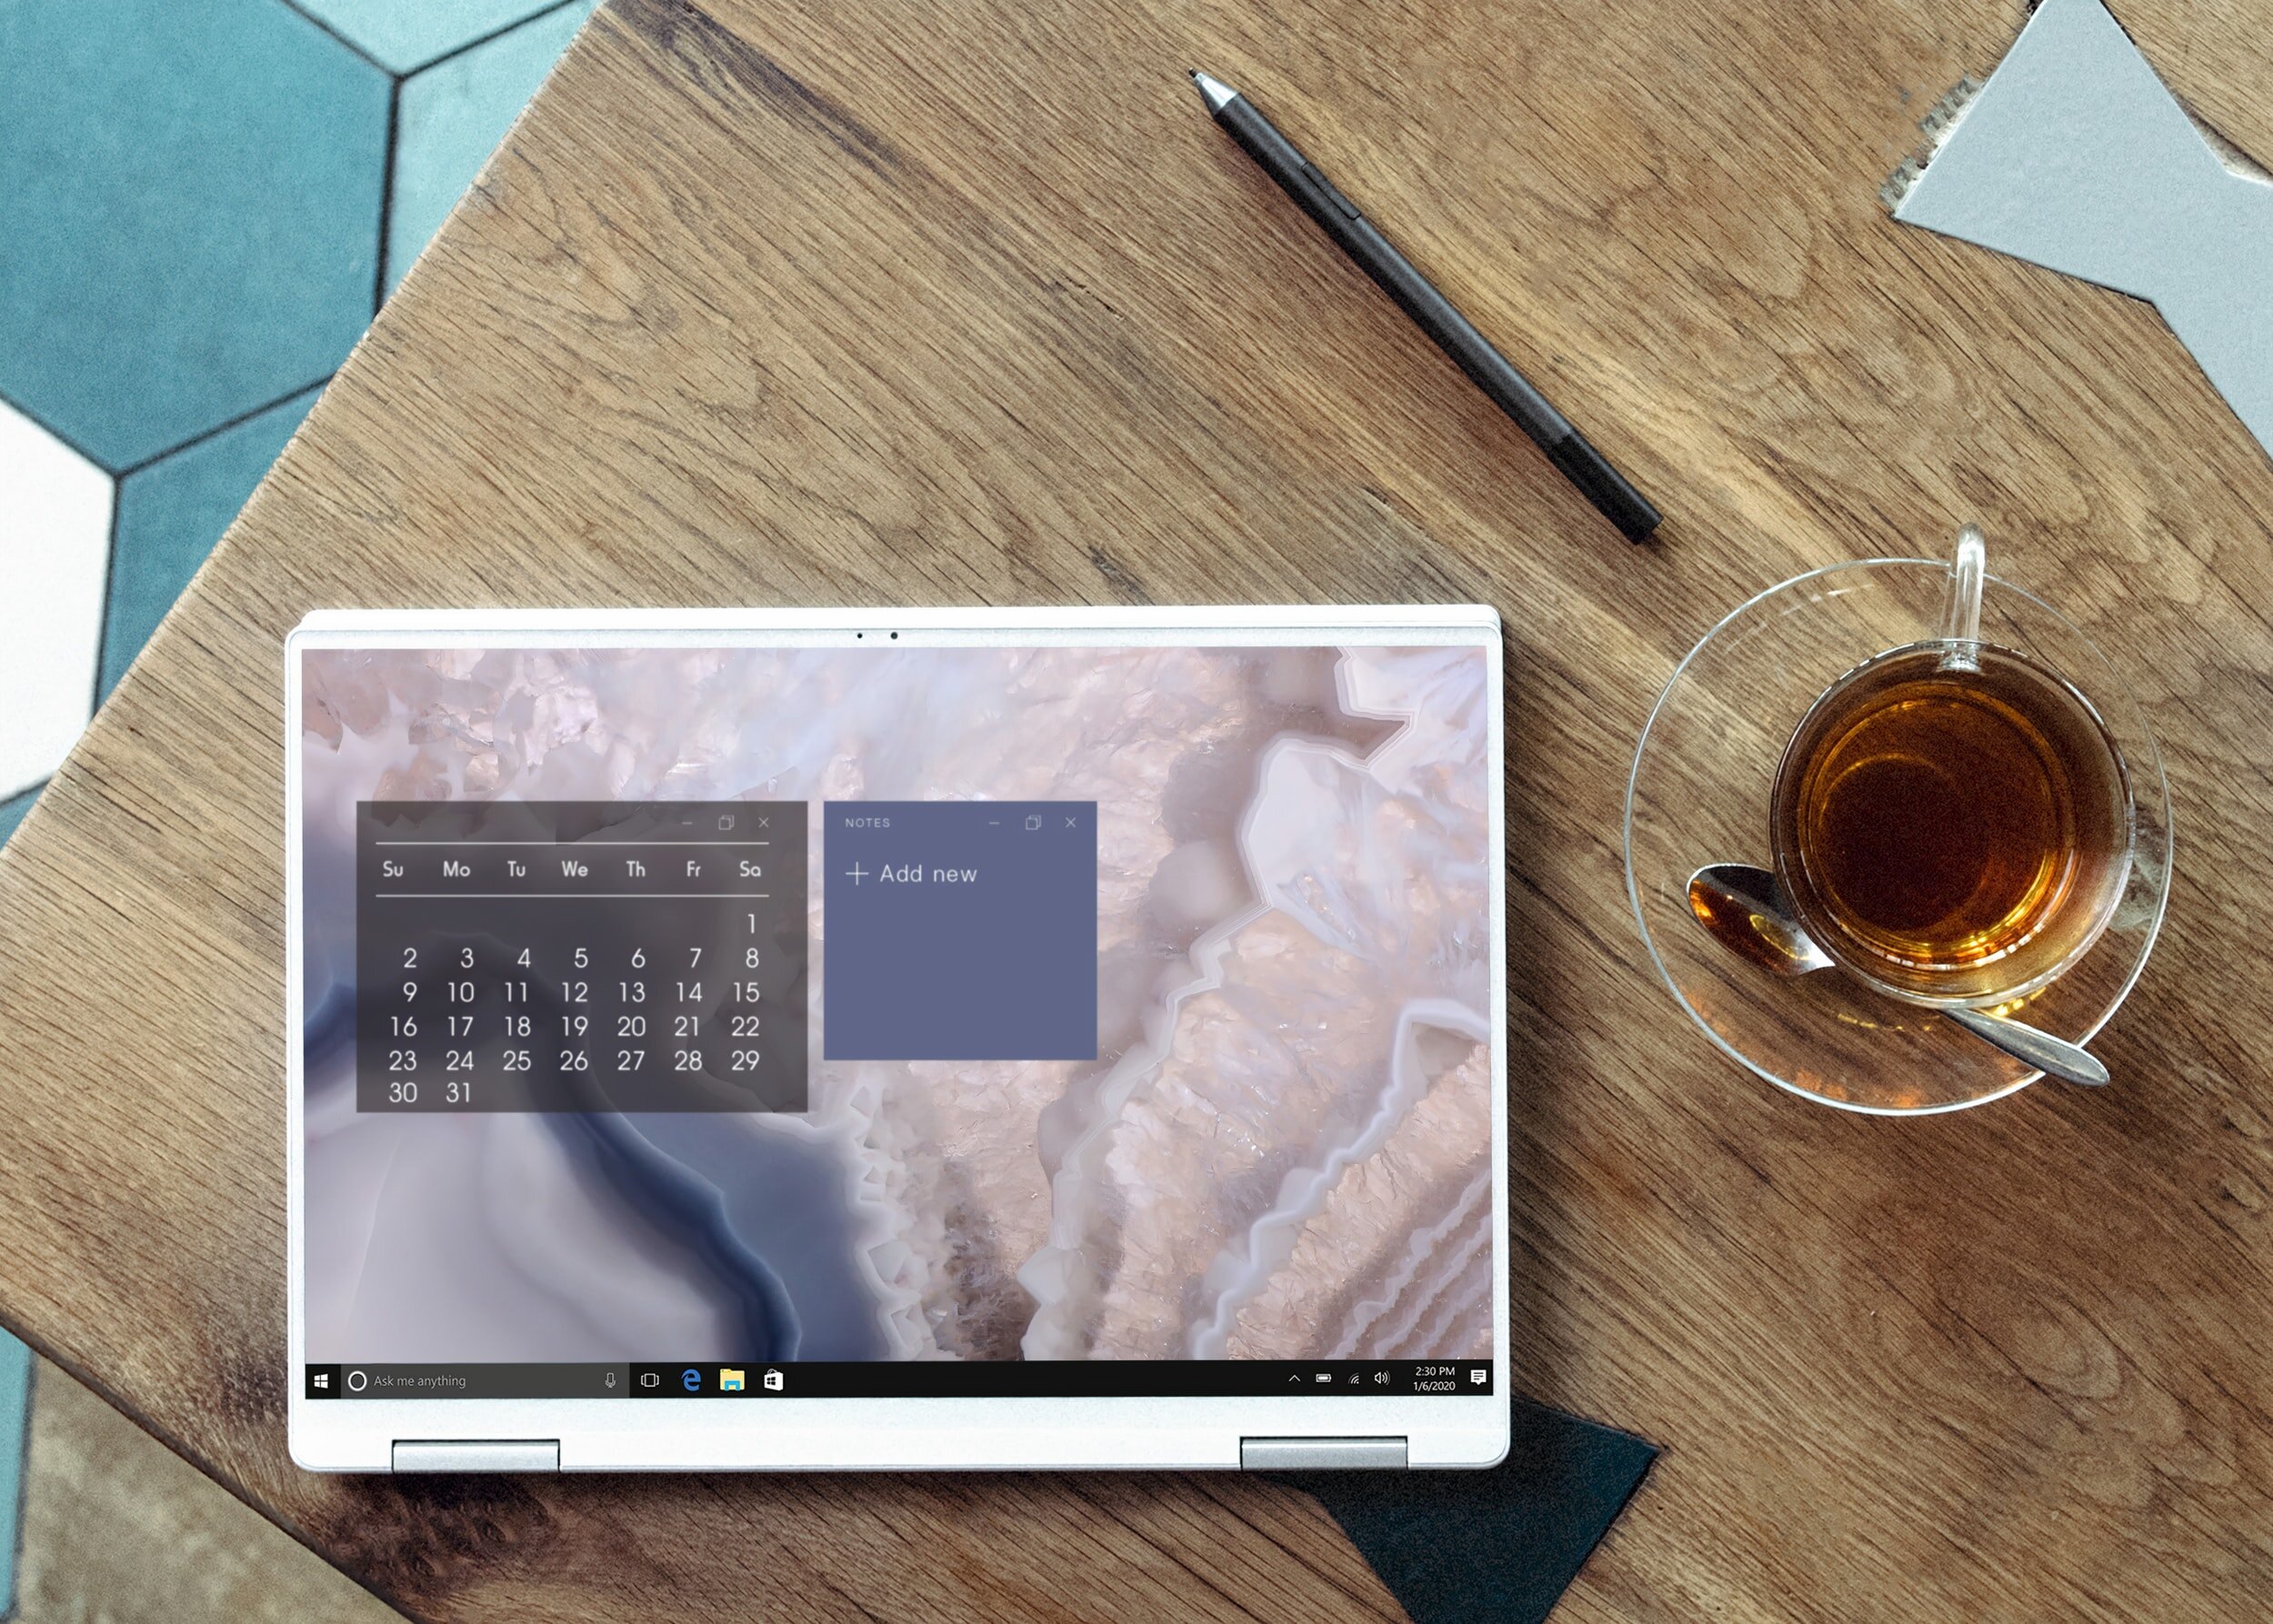
Unbundling the remote quantitative methods academic: Coolest tools to support your teaching
This year’s lockdown challenged the absolute core of higher education and accelerated or rather imposed the adoption of digital tooling to fully replace the interactivity of the physical classroom. And while other industries might have suffered losses, the edtech space flourished, with funding for edtech almost doubling in the first half of 2020 vs 2019. Even before the pandemic, lecturers were starting to feel overwhelmed by the amount of choice to support their teaching. More funding just meant more hype, more tools, and more tools working on similar or slightly improved solutions, making it even harder and more time-consuming to find and adapt them in a rush.
Below, we take a look at several tools and startups that are already supporting many of you in teaching quantitative research methods; and some cool new tools you could use to enhance your classroom.
What a year...Here are our top posts of 2020: From text mining tools in the social sciences to running online experiments and visualizing COVID-19 data
The SAGE Ocean Blog started the year off with a piece on our recently published white paper on software tools for social science. Next week we’ll publish a piece from senior product manager Daniela Duca on the challenges of running social science experiments from home and what tools can help. The move to online teaching, learning, and research feature heavily in our top posts of 2020. Back in April Katie Metzler wrote about the challenge COVID-19 to student research projects and in May, Jason Radford provided some helpful recommendations for translating studies into an online format and recruiting virtual participants.

Designing trust relationships in research with Knowsi
Watch the webinar recording and read the follow-up blog from our webinar with SAGE 2020 Concept Grant winner, Andrew Lovett-Barron, on how to design trust relationships with participants in research using Knowsi.

Coordinating global cities research: Knowsi case study
“We haven’t met yet. Do you trust me?”
This is the dilemma that any researcher faces at the outset of their recruiting process — to find people who are willing to share their stories, experiences, frustrations, and victories with a total stranger. The secret to building trust often comes down to explaining in person while performing the interview — creating a rapport with the research participant and listening deeply and critically to their stories.
Life on the screen
As technology becomes more integral to everything we do, the time we spend in front of screens such as smartphones and computers continues to increase. The pervasiveness of screen time has raised concerns among researchers, policymakers, educators, and health care professionals about the effects of digital technology on well-being. Despite growing concerns about digital well-being, it has been a challenge for scientists to measure how we actually navigate the digital landscape through our screens. For example, it is well documented that self-reports of one’s media use are often inaccurate despite survey respondents’ best efforts. Just knowing screen time spent on individual applications does not fully capture a person’s usage of the digital device either. Some could spend an hour on YouTube watching people play video games whereas others might spend the same amount of time watching late night television talk shows to keep up to date with the news. Even though the screen time is the same for the same application, the intentions and values of consumption of certain types of content can be vastly different among users.

When reading a visualization is what we see really what we get?
When reading a visualization, is what we see really what we get? There are a lot of ways that visualizations can mislead us, such that they appear to show us something interesting that disappears on closer inspection. Such visualization mirages can lead us to see patterns or draw conclusions that don’t exist in our data. We analyze these quarrelsome entities and provide a testing strategy for dispelling them.

The validity problem with automated content analysis
There’s a validity problem with automated content analysis. In this post, Dr. Chung-hong Chan introduces a new tool that provides a set of simple and standardized tests for frequently used text analytic tools and gives examples of validity tests you can apply to your research right away.

A new tool for collecting and analyzing homicide data: Homicide Media Tracker Part 2
SAGE Concept Grant winner Dr Nechama Brodie introduces the Homicide Media Tracker, a tool currently under development that will enable the collection, curation and analysis of crime data in media. Why is it needed? What kind of data will the tool be able to collect? And what insights can this data afford researchers?
Leveraging the potential of media data for the study of violent crime: Homicide Media Tracker Part 1
Media reports are a valuable source of crime data that can be used to supplement police and judicial records. Nechama Brodie explains the challenges and opportunities of working with this type of data, and introduces a new tool concept for the collection and analysis of homicide data.