How can we judge the trustworthiness of a research finding?
By Dr. Stephen Gorard. Dr. Gorard, author of How to Make Sense of Statistics, was a Methodspace Mentor in Residence in 2021.

Use the code MSPACEQ323 for a 20% discount
Whatever kind of data you are working with, and whatever techniques you use to compute the summary results, the true nature of any analysis lies in your use of judgement to decide how good these results are, and what they mean. The real analysis is the process of judging whether your graph shows a pattern, and what that pattern portrays. Or whether the difference between two or more mean scores is substantial and robust enough to be worthy of further consideration, and how that difference might be explained. This requires considerable craft skill, and is best approached with great clarity, and with any arguments and assumptions laid out as simply as possible.
There are several alternative models for steps in judging how trustworthy any piece of research is (your own, or a study by someone else that you are reading). But they are very similar. The model below is perhaps the simplest, and has been shown to produce consistent ratings across teams of researchers.
The first step in the suggested procedure concerns reporting and comprehension. Judging the quality of a piece of research necessarily relies on full and comprehensible reporting of its methods and findings. For example, it is not possible to judge whether the research design used fits the research question, unless the question and design are both clearly stated in the research report. Similarly, it is not possible to judge whether the research has enough cases to be convincing if the number of cases is not stated in the research report.
As you read more research papers, you will notice that the standard of research reporting in social science needs to improve. Many of the key elements of empirical research studies are not clearly reported in so much social science. Much reporting is almost entirely incomprehensible, with long words and sentences, neologisms, uncensored lengthy extracts from software reports, and so on. Much of the remaining reporting is incomplete – presenting means without standard deviations, with no mention of missing data, or no description of how many respondents said one thing or another. In any report you read where it is not possible to find good information about the key elements, such as the research question(s), its scale and so on, the study should be treated as of no consequence, and can be ignored. This may seem harsh but there is no real alternative.
Using the “sieve”
There are a number of factors to consider when judging the quality of a comprehensible and reasonably comprehensive research report, which could be considered in any order. However, it would make sense to start with the fit between the research question(s) and the study design. Other key factors to consider would be the size of the study in terms of numbers of cases, the nature and amount of missing data, and the quality of the data or measurements. There are plenty of other considerations relevant to the internal validity of a study including conflicts of interest, pre-specification of analyses, and appropriateness of analyses. However, here we will focus on the first four issues, because once these are decided then the other factors either generally fall into line as well, or at least cannot make our judgement worse.
The table below summarises these factors in four columns, with a generic description of research quality, judged in terms of each factor for each row. And it summarises each row with a security (padlock) rating in the final column. The overall rating suggests a research finding whose trustworthiness is at least at the level of the descriptions in that row. So 4🔒 suggests a study that is as secure as could reasonably be expected (because no research will be perfect), and 0🔒 represents a study that is so insecure that it adds nothing of any value to our knowledge of social science. If you reviewing literature then it is crucial that such judgements inform your review.
A ‘sieve’ to assist in the estimation of trustworthiness
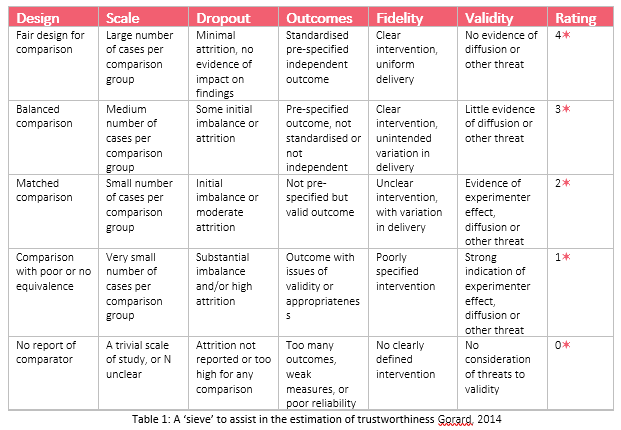
A suggested procedure for using the table would be to start with the first column, reading down the design descriptions until the research you are reading is at least as good as the descriptor in that row. Staying in the row achieved for the design, move to the next column and read down the descriptions, if needed, until the study is at least as good as the descriptor in that row. Then repeat this process for each column, moving down (never up) the rows, if needed, until the study is at least as good as the descriptor in that row. For any column, if it is not possible to discern the quality of the study from the available report(s) then the rating must be placed in the lowest (0) category. Each study sinks to its lowest level on these four key factors. The final column in the table gives the estimated security rating for that study.
Of course, there are no objective criteria for deciding on any rating, and the table’s cell descriptions deliberately do not include numeric thresholds. For example, the phrase a “large number of cases” might depend upon the precise context, question or pay-off. There is also an interaction between the simple number of cases, their completeness, representativeness of a wider set of cases, and the integrity of the way they have been allocated to groups. “A large number of cases” would certainly be in the hundreds, but there is no precise figure such as 400 that can be set, other than as a rough guide. An excellent study might have one case below whatever threshold is suggested (399), and a weaker one might have one more (401).
If, and only if, you are happy with the security of any research finding then it makes sense to proceed to consideration of what the result might mean. And whether it might also be valid more generally, for cases not involved in the study. The result might mean little or nothing of course. Trustworthiness and substantive significance are not obviously related. Just as a weak result might appear exciting, so a secure result might be uninteresting, or meaningless.
My new book has chapters on each of the columns in the sieve, and how to judge the trustworthiness of any study in relation to that column.
Stephen Gorard is the author ofHow to Make Sense of Statistics, Professor of Education and Public Policy, and Director of the Evidence Centre for Education, at Durham University. He is a Fellow of the Academy of Social Sciences, and a member of the Cabinet Office Trials Advice Panel as part of the Prime Minister’s Implementation Unit. His work concerns the robust evaluation of education as a lifelong process. He is author of around 30 other books and over 1,000 other publications. Stephen is currently funded by the British Academy to look at the impact of schooling in India and Pakistan, by the Economic and Research Council to work out how to improve the supply and retention of teachers, and by the Education Endowment Foundation to evaluate the impact of reduced teacher marking in schools. Follow him on Twitter @SGorard.
More Methodspace Posts about Data Analysis


Looking back at 2023, find all posts here!
We explored stages of a research project, from concept to publication. In each quarter we focused on one part of the process. In this recap for the year you will find original guest posts, interviews, curated collections of open-access resources, recordings from webinars or roundtable discussions, and instructional resources.