Working with population data
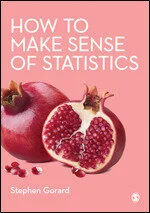
by Stephen Gorard, PhD. Dr. Gorard is Professor of Education and Public Policy, and Director of the Evidence Centre for Education, at Durham University. He is the author of How to Make Sense of Statistics, and served as a Methodspace Mentor in Residence in 2021.
What is a population?
In social science, the ‘cases’ are the individuals, organisations or objects selected to take part in the research. A population is the set of all cases that are eligible and relevant, and that had a genuine chance of taking part in the research. If all of these cases are involved, or are invited to be involved, in the research then the study is of a population (rather than of a ‘sample’). It is a kind of census.
Examples of population studies include the 1958 National Child Development Study and the 1970 British Cohort Study which are following all of the babies born in Britain in one week. Of course, some families did not agree to take part, and some cases have dropped out since the start, but these factors simply make the population in the study incomplete. They do not make it a sample study. And the missing cases are not a random subset of all cases. Further examples of population studies would include the national census of population, a comparison of all the schools in one city, the full set of cases being randomly allocated to treatment groups in an experimental design, and a survey of all of the patients in one hospital. A population, in this sense, can be of people or any other types of cases like institutions or books.
What all of these population examples have in common is that the study involves or attempts to involve every relevant and eligible case. If a study surveys all of the patients in one hospital this is the population for that study. There can be no patients in that hospital that are not meant to be part of the study, while patients in other hospitals, and people not in any hospital, had no chance of being in the study. The latter are not part of the population for the study.
The advantages of working with population data
Choosing to work with a population is a research design issue, and so is independent of the methods of data collection (we might interview the cases or measure something about them, or both, for example). In a lot of social science, one of the aims of research is generalisation to the population. The beauty of working with population data is that this generalisation is already achieved, by definition. No further analysis (such as the use of inferential statistics) is needed, or appropriate in order to generalise. This makes population research intrinsically more rigorous, and more convincing in its claims, than equivalent studies involving only samples.
Analysis of population data is easier than for samples, without issues of statistical generalisation. This tends to allow analysts a greater focus on the matters that really count – such as the meaning of the data, its quality and completeness. A researcher may still wish to generalise from the population in the study to other populations, but this is a judgement-based generalisation. Such generalisation is done on a case-by-case basis, treating the research population as a new form of case. For example, it may be that the results of a survey in one hospital provide lessons for other hospitals, even in other countries, and perhaps even to other public institutions likes schools and prisons. But no statistical generalisation based on sampling theory is possible or needed to provide the basis for those lessons.
Analysing population data
It is common to look at patterns within population data, or differences between sub-groups. Dividing a population into heterogeneous sub-groups generally produces groups that are themselves populations, and all of the advantages and restrictions outlined above still apply. For example, if the study involves all of the students in one school, then dividing the students into two groups by their birth sex produces two further populations – all of the girls in one school, and all of the boys. Claims about the comparisons, differences, trends, or patterns in these sub-groups are still claims about populations. No traditional statistics can be involved.
When an analyst conducts a simple test of significance like a t-test for two groups the analytical question they are trying to answer is whether the difference between groups found in the sample is also likely to be true for the population from which the random sample was drawn. With population data and no sample (random or otherwise) this is a redundant analytical question, and so anyone running a significance test, or similar, with population data is admitting to their readers that they have no idea what they are doing. Any difference found between groups (such as boys and girls) in the population data is the difference in the population. Similarly, no confidence intervals are needed; nor could they mean anything in this context. Analysis of populations is therefore as simple as it is possible to be, and can involve totals, means, percentages, graphs, correlations, indices of inequality and so on, just as with any numeric data. Population data can also be modelled using techniques like regression analysis, as long as care is taken that the software involved is not making default decisions about the model on the basis of covert significance tests.
Of course, it is unlikely that any real dataset will actually be complete. The census of households every ten years in the UK misses some residents, such as those away from home for a long period, the homeless and a minority who cannot or will not complete the form. This does not make the UK population census into any kind of sample. This merely makes it an incomplete census, as all population data will be in real-life. Therefore, the key issue for analysis is not generalisation but consideration of the missing cases and data and how these might influence any findings.
There will be cases missing that we do not know about, such as those without a household in the UK census of population. There will be cases missing that we know about, such as those who refused to complete the UK census of population. There will be cases in which one or more variables are missing, such as where a respondent refuses to answer a specific question. There will be cases in which the recorded response for one or more variables will be incorrect or invalid, such as where a respondent misunderstands a question, or incorrectly portrays their desired answer. All of these problems introduce bias to the results for the ‘population’, and must be taken into account when presenting results for that population.
However, none of these problems has a technical solution, and none involves significance testing or any traditional statistics. It would obviously be wrong to base an assessment of what was missing or erroneous on the data that was successfully collected. For example, it would be dangerous to use information successfully collected about households to ‘imagine’ or impute data about those people without homes. Perhaps the best that can be done is to try and envisage the scale of the problem with any dataset, and work out how different any missing/erroneous data would have to be for the security of any findings from the existing data to be put in danger.
Stephen Gorard is the author of How to Make Sense of Statistics, Professor of Education and Public Policy, and Director of the Evidence Centre for Education, at Durham University. He is a Fellow of the Academy of Social Sciences, and a member of the Cabinet Office Trials Advice Panel as part of the Prime Minister’s Implementation Unit. His work concerns the robust evaluation of education as a lifelong process. He is author of around 30 other books and over 1,000 other publications. Stephen is currently funded by the British Academy to look at the impact of schooling in India and Pakistan, by the Economic and Research Council to work out how to improve the supply and retention of teachers, and by the Education Endowment Foundation to evaluate the impact of reduced teacher marking in schools. Follow him on Twitter @SGorard.


Looking back at 2023, find all posts here!
We explored stages of a research project, from concept to publication. In each quarter we focused on one part of the process. In this recap for the year you will find original guest posts, interviews, curated collections of open-access resources, recordings from webinars or roundtable discussions, and instructional resources.