Starting out with qualitative analysis software
by Dr. Daniel Turner, Founder and Director, Quirkos Software. After gaining a PhD using qualitative research in global health, Daniel spent a decade on qualitative research projects at various UK universities. Daniel left academia to develop Quirkos to fill a need for a simple qualitative analysis tool. He still tries to keep up with qualitative research, running workshops on Quirkos and qualitative research across the world. He has written several textbook chapters and a regular blog on qualitative methods with more than 160 articles.
For more about Quirkos, see their blog.
When new researchers look at qualitative software for the first time, it can be a bit overwhelming: both the software itself and the raft of different packages. But there are some basic tips that can help break down the planning process, and get you coding and exploring your data.
The first step is to understand what is required by your analytic process. This will depend on the type of qualitative data you are using, your research questions and most importantly your epistemological stance. During your literature review, you probably will have decided on the best data collection methods to answer your research question, but this should also suggest the best way to analyse the data.
Contrary to popular belief, there isn’t one software package that is ‘best’ for a particular approach like grounded theory or IPA, they are all pretty flexible and can work with all types of analysis. It’s more likely that what works best for you depends on how you prefer to organise information: Do you think in lots of subheadings? Are you a visual thinker? Do you prefer to plan a structure at the start, or improvise?
Try and think about what you would like the process to be first, before trying too many qualitative packages. It’s easy to be seduced by features, but you should use them for what you want to do, and not try to force fancy features to work with your analysis. The 5 Level QDA approach advocates just this: encouraging you to think of the strategies and tactics you will need, and mapping these onto the components of the software packages. But regardless of your plan of action, there will likely be certain key things you need to do:
1. Bring in your data
Whether your data is interviews, focus groups, or art based, you will want to bring it into the software to work with. Not all software can import audio and video data, but you should think about transcribing your data as well. All software packages will also allow you to organise or describe attributes or properties in the data (such as demographics of your respondents), and this can help with comparative analysis and exploring differences in the data. Think of qualitative software as being part of a management system that helps organise your data (as well as your analysis), which is why it is also useful to...
2. Include your literature!

I’m a strong advocate for treating your academic literature as a source of data – bringing journal articles and textbook chapters into qualitative analysis software can really help when doing a literature or systematic review, but also in the writing up process. Thematically code research papers or chapters in the same way you explore your dataset, and it’s easy to compare the literature to your findings when you come to write up.
3. Create codes, themes or topics
Regardless of whether you are using grounded theory and doing inductive coding, or a framework analysis approach with a-priori codes, at some point you will create codes and/or themes in your data. These two types of approach will decide whether you create these before getting into the data (framework) or create them as you go (theory building / grounded theory). All qualitative software packages allow you to do both approaches, a good thing since many people end up doing a bit of each. Then you assign sections of the data to one (or more) codes or topics, building up patterns across your data.

Software also can help you organise basic codes into more insightful themes, and manage approaches with multiple stages like open and axial coding. At some point, you should have developed a codebook, essentially a list of codes/themes with relationships to each other, and detailed descriptions for what they mean. Note that the definitions and even names of these codes can change through the analysis process, and this is quite normal!
4. Use reflexive writing
Many people doing qualitative analysis can become too focused on codes and themes, but there are other important ways to understand qualitative data. Many people think best by writing – trying to articulate to themselves or others what they see in the data. This can take the form of memos or notes about a particular extract of the data, suggested by some approaches like IPA that use line by line coding. But it can also be helpful to keep a reflexive journal or research diary that records notes and insights into the whole research project.
All qualitative software packages allow you to write directly into them, in a variety of formats – long-form or short. Keeping your notes and writing together in your project allows you to keep the flow when analysing, and also cross reference them when writing up.
5. Read your data
New qualitative researchers sometimes come to the end of the coding process, and struggle with what to do next, and moving to wider conclusions. Remember that the aim with most qualitative analysis is to keep reading the data in different ways, to uncover non-obvious trends or new theory. So reading by the contents of the code rather than source can help you see trends or contradictions across different participants, and tying to get your themes to connect with each other can show a wider story, or deeper causations. Qualitative software can make this much easier than going through many sources on paper, looking for bits highlighted in a particular colour.
And if one analysis method didn’t work, try another! Sometimes trying discourse or action analysis rather than simple thematic analysis can show things in a different light.
6. Write up your data
For many, this is a main aim of a research project: creating an output like a thesis, paper or report that communicates your findings. It’s worth remembering this while doing all the above, so that you keep some focus on how and what you are going to write. Using qualitative software makes it much easier to find quotes to illustrate and support your arguments. It often helps to write some sections around key themes, and all the sections of data you’ve assigned to these themes are easy to see (and copy and paste) to bring in.
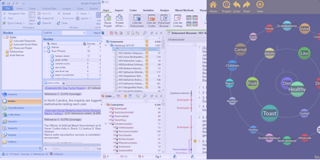
This is where all the hard work you’ve put into reading and coding the data comes pays off – all the quotes that illuminate your data are now at hand to fill in your chapters, and structure your writing. In Quirkos for example, every quote has a copy button next to it, ready to put into wherever you are writing up. It may also be helpful to show the codebook as an appendix or figure, and to share with co-writers and supervisors that want to see how you have interpreted the data – again qualitative software gives you reports and exports that show and communicate the process.
These are the main stages, there may be more or less depending on your approach. However any qualitative research software will help you with these parts, and all have free trials so you can see which works best for you. Quirkos gives a simple and visual approach, and you can try this tool for qualitative analysis free offline for 21 days, or for 14 days with unlimited cloud storage and collaboration.